
Introduction
For over 30 years, the data were collected as the Earth surface images, thanks to a series of specialized satellites for remote sensing of the Earth’s surface, called Landsat. In all these years, an enormous amount of information has been collected and processed and allowed to monitor changes in the environment throughout this period. These data are available for free to anyone interested.
The remote sensing with image acquisition
The remote sensing is the technique that allows you to capture information on the Earth’s surface, through an appropriate analysis of the data collected through remote sensors measuring the different frequencies of the electromagnetic radiation spectrum in emission, reflection, and transmission.
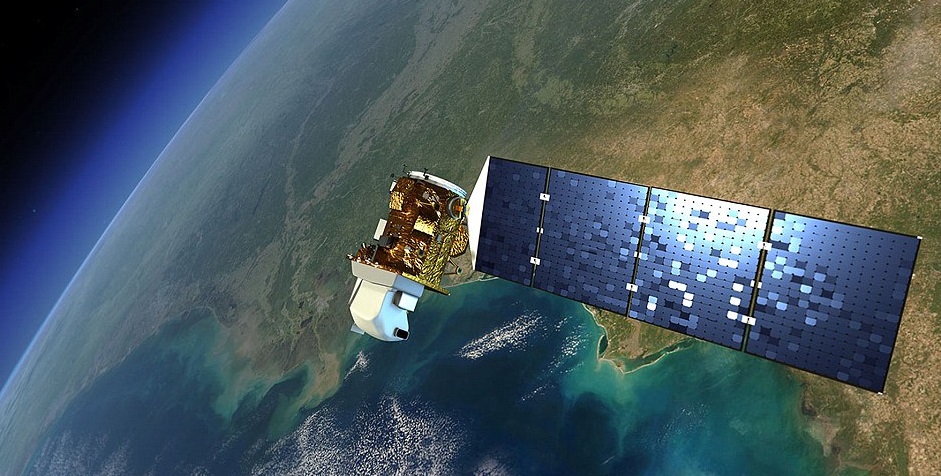
Generally for remote sensing, systems such as aircraft, drones, satellites or space probes (surfaces of other planets) are used.
Three values are countless using this technique. One of these is the climate and weather information, but many other applications are possible: environmental impact observations, crustal movements, resource analysis, ocean current movements, salinity of the oceans, and so on.
The Landsat program
The Landsat project is a network of remote sensing satellites used to providing information free and open to all, in particular way for researchers and environment agencies. This project is supported by NASA (National Aeronautics and Space Administration).
The first satellite, Landsat-1, was put into orbit in 1972, followed by other satellites. Over the years, these formed the satellite network called as Landsat program. The older ones were gradually replaced by more modern and advanced ones. Currently the two satellites, Landsat-7 (launched in 1999) and Landsat-8 (launched in 2013) are in operation.
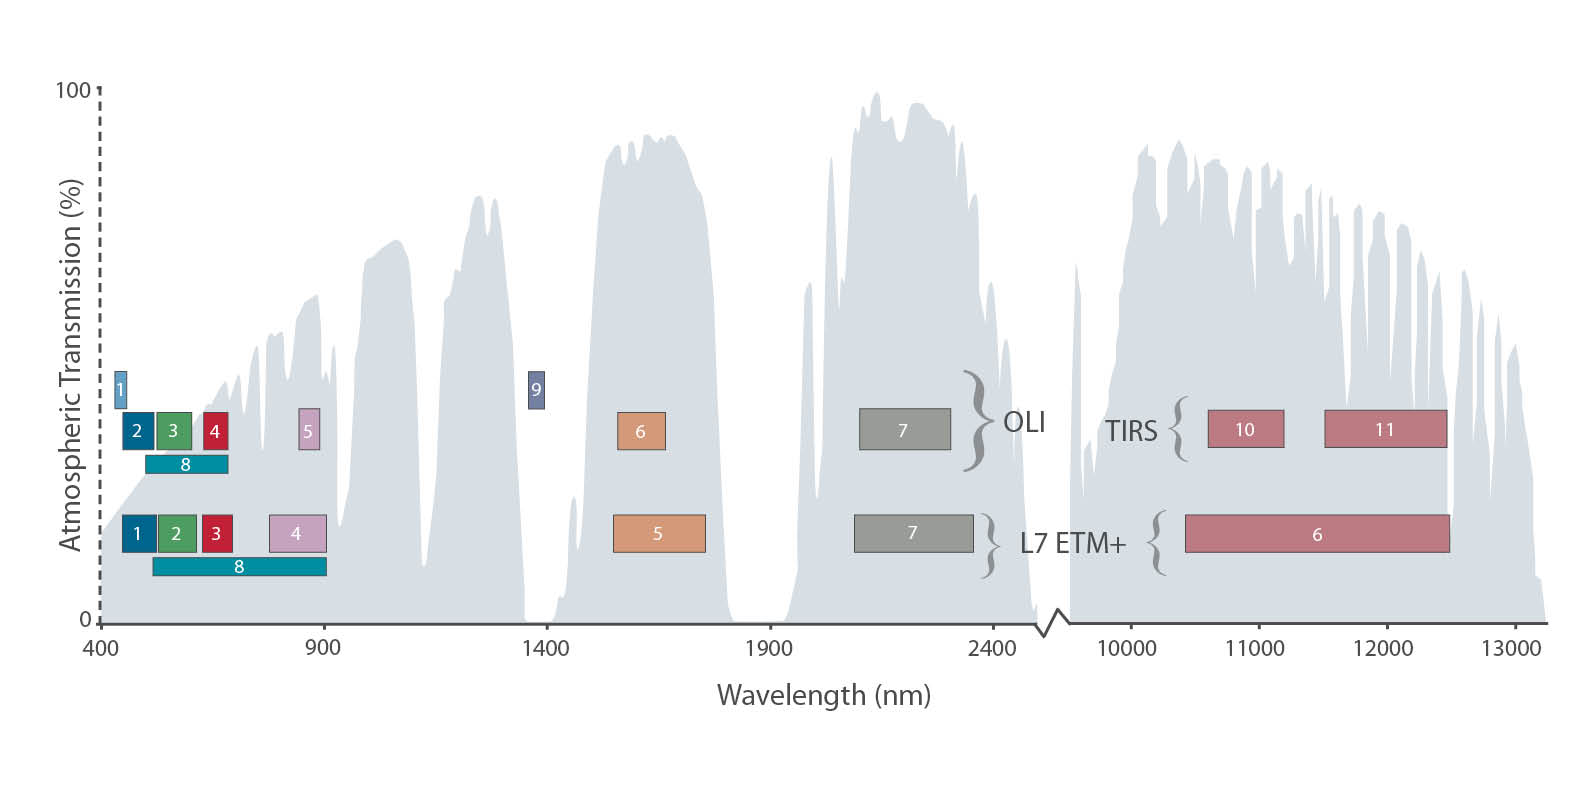
The first satellites could only detect spectral bands limited by mounting a sensor type MSS (Multispectral Scanner). Also, the spatial resolution was very low (about 80 meters). The last two models, Landsat-7 and Landsat-8, fitted sensors based on innovative technologies that have expanded greatly the detectable spectrum and also the spatial resolution, bringing it to about 30 meters (15 meters for the panchromatic spectrum). The Landsat-7 uses a sensor ETM + (Enhanced Thematic Mapper) and the Landsat-8 uses OLI (Operational Land Imager). In addition, the Landsat-8 also has the TIR (Thermal Infrared Sensor) that allow you to extend the observations also in the infrared.
In the figure below you can see the difference between the detection spectra of the two satellites: Landsat-7 and Landsat-8.
The survey data
As regards the Landsat project, the most interesting aspect is that most of the data, collected in the last 30 years, are available online freely. So anyone interested in studies or analyzes of data can make use of this huge source of data.
One of the most interesting sites where you can access the data acquired by Landsat satellites (and not only) is the official site of the USGS United States Geological Survey, a scientific agency for monitoring and studying the changes in the US territory. As you access to this site you will be proposed to choose an application in order to graphically access the data you are looking for. The three applications are:
- Global Visualization Viewer (GloVis)
- EarthExplorer
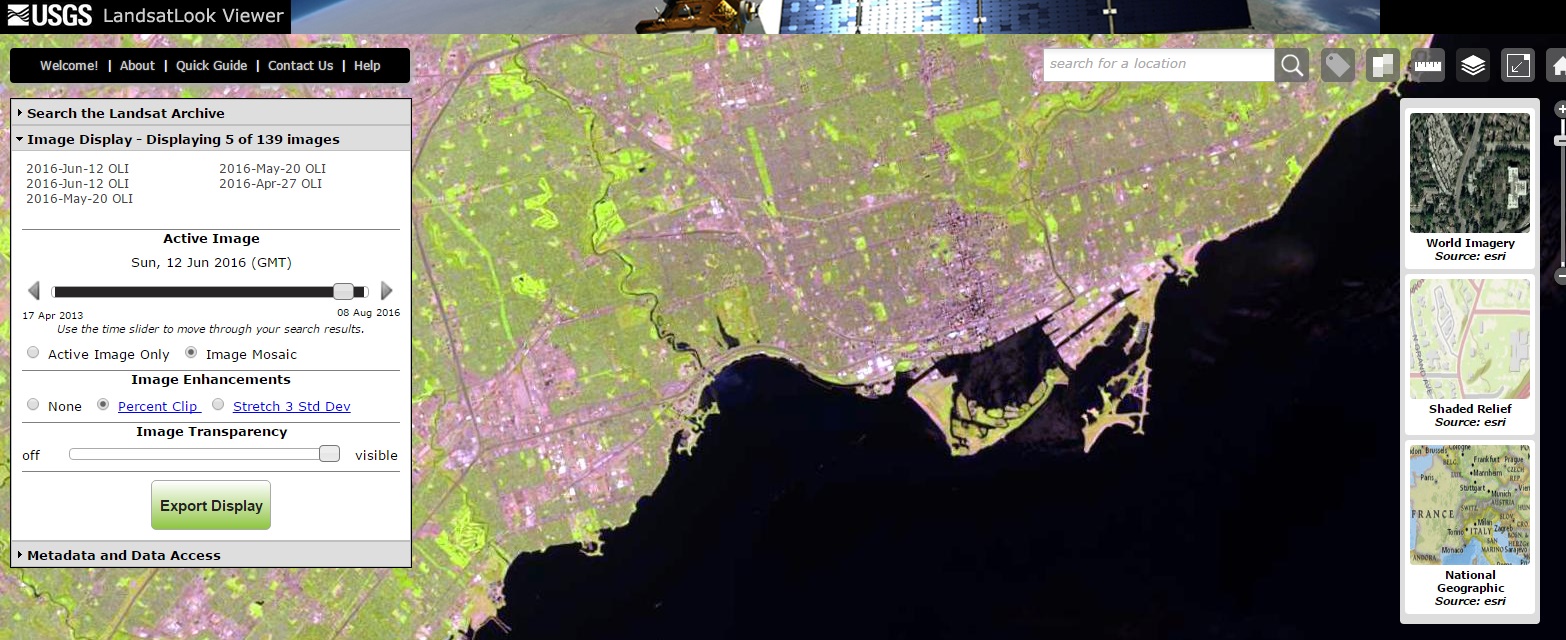
- LandsatLook Viewer
The LandsatLook Viewer allows you to quickly display all data acquired by Landsat and compare them directly with the maps.
Instead if you want to download the data you can use the Glovis viewer. This application runs directly from your browser but requires Java (it is likely that you will need to do some upgrades and unlock some permission in order to use the Java plugin on your browser …;) ). Once you are in, you can browser on the world map and select the area of interest. For example Italy.
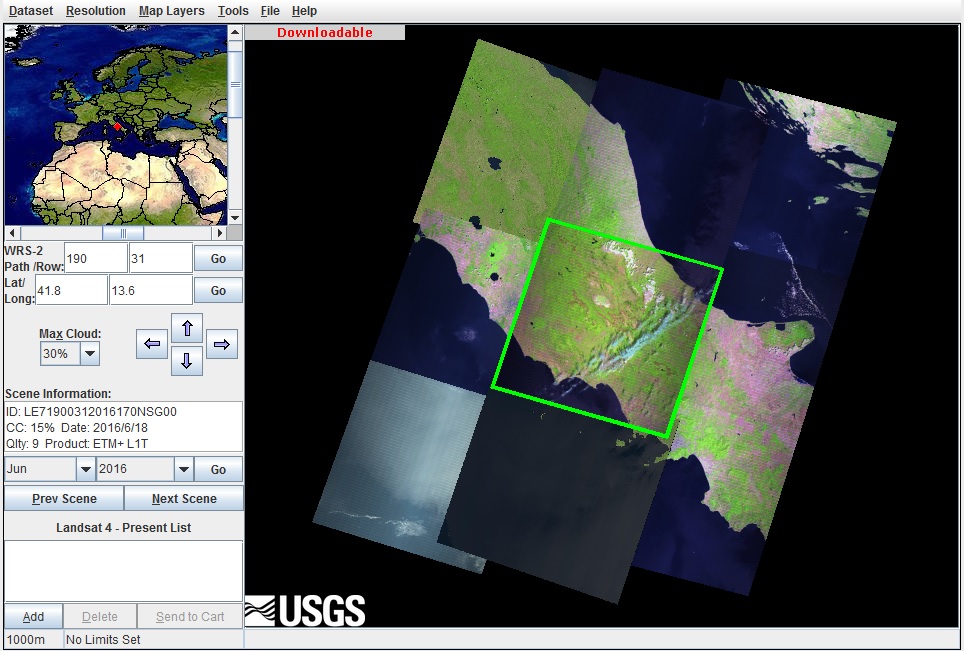
Once you have selected the geographical part of your interest, you can download the data choosing some options such as the absorption spectrum, the sensor, the date, etc .. clicking on the Dataset item on the menu. For example, you could be interested to data read by the OLI sensor mounted on Landsat-8.

Then you press “Add” to add the map to the request (you can ask for more than one) and then “Send to Cart” to request the data download. First, you have to register, but the download is completely free. So, once you registered, insert User and password. Then choose the kind of image you want to download.

If your purpose is the data analysis, you should download the Level 1 GeoTIFF format of data. You will get a zip filecontaining a different TIFF file for each band.[:]