Introduction
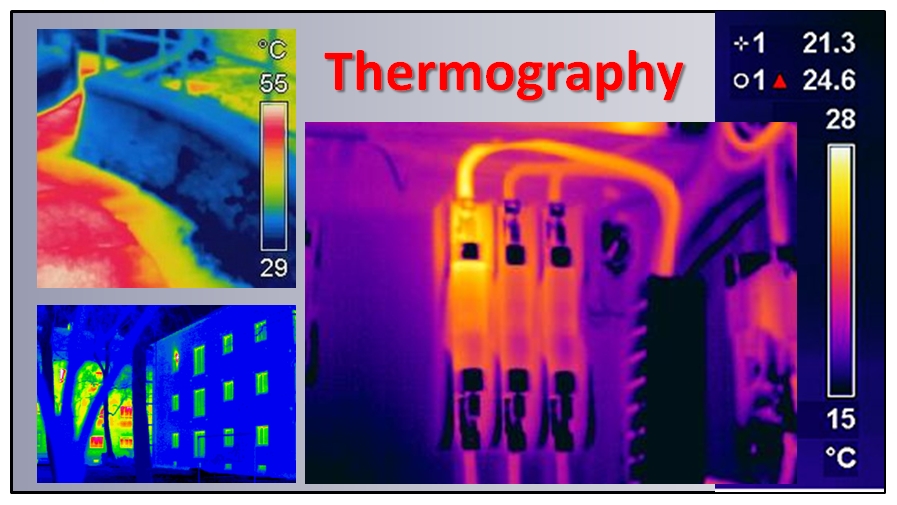
In recent years in the field of electrical systems, especially with regard to the maintenance of plant and equipment in general, thermography has developed considerably. Thermography is a term derived from the Greek words “thermos” which means heat and “gràphen” which means to draw or draw the heat. Thermography is a non-invasive diagnostic technique that allows to identify the values of surface temperature without coming into direct contact with the electrical components through the visualization and measurement of the thermal energy emitted from an object.
Some history
Thermography is a particular diagnostic technique for the remote detection performed through the acquisition of images in the infrared field exploiting the physical principle according to which any body or object emits energy in the form of infrared radiation invisible to the human eye when it is a temperature above absolute zero (0 K = -273.16 ° C), (see figure 1). With this technique it is possible to detect temperature differences of the order of one hundredth of a degree at a distance and without contact.

The human eye is in fact able to identify only the electromagnetic radiation that constitutes the spectrum of visible light, which goes from a wavelength of 0,4μm to 0,7μm. All other forms of electromagnetic radiation, including infrared radiation, are not visible.
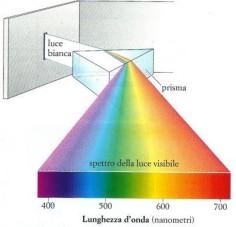
Frederick William Herschel, an astronomer at the court of King George III of England, was the scientist who first discovered the infrared radiation was in 1800. Decomposing the sunlight through a glass prism, he was able to measure the temperature of each color of the rainbow so obtained, discovering that corresponded to different colors at different temperatures and above all that the temperature increased toward the red, reaching maximum value over the red area, in a band of the spectrum where the light of the sun was not visible. Herschel called this phenomenon thermometric spectrum ( see figure 2).
Later in 1829 the physicist Leopoldo Nobili and in 1830 the physicist Macedonio Melloni made further progress up to the first thermal image made by the son of William Herschel, John, who obtained an image through a system of evaporation of oil contained in a thin film.
The modern thermographic equipment, however, takes advantage of the invention of the bolometer in 1881 by Samuel Langley, who was able to detect the infrared radiation emitted from a cow at a distance of three hundred meters.
A further and final step in the creation of modern, compact thermographic equipment, has been done by means of the invention of the cooling system of the sensor through the use of liquid nitrogen enclosed in airtight containers invented by James Dewar, a Scottish scientist who first, in 1904, created a type of container with insulating double silver glass walls in vacuum for the storage of liquefied gases (Dewar vessels). Until 1960 the development of infrared technology has been the exclusive competence of the military sector, and only after 1960 the infrared technology has also been developed for civilian purposes.
Infrared radiation
Infrared radiation is a part of the electromagnetic spectrum hitherto known. Its wavelength is between 1 mm and 750 nm (300 GHz and 400 THz) and is placed between the band of the visible radiation and that of radio waves. This type of radiation is manifested in the form of heat and can be detected with the use of a particular instrument, the bolometer. The term Infrared comes from the Latin “infra” below, it means under the red and indicates that its frequency is immediately below that of the red color of visible light. In Figure 3, the electromagnetic spectrum is shown schematically in particular with regard to visible light.

Electromagnetic waves are also called infrared thermal radiation or heat radiation. They travel at the speed of light and have as main characteristic that it does not heat the air but the surfaces. Following their vastness in the electromagnetic spectrum and to various fields of use, their frequency band is divided into the following areas not standardized, represented in Figure 4:
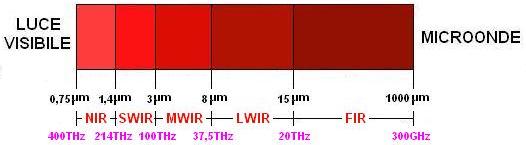
- Near Infrared Radiation is the area closest to the band of visible light. It has a wavelength of 0.75 mM (400 THz) to 1.4 mM (214 THz). It is used primarily for photography and reflectograph non-destructive technique for the examination of painted surfaces, in this area of the infrared is also emitted about 50% of the solar radiation for the remaining 45% is emitted in the visible and about 5% in the ultraviolet band;
- Short Wave Infrared Radiation has a wavelength from 1.4 mM (214 THz) to 3 mM (100 THz). It is used for the measurement of high temperatures;
- Medium Wave Infrared Radiation has a wavelength from 3 mM (100 THz) to 8 uM (37.5 THz). It i s generally employed for the identification of objects or gases;
- Long Wave Infrared Radiation has a wavelength from 8 uM (37.5 THz) to 15 mM (20 THz). It is the band most used for thermography. Its frequency is the most suitable for the observation of environmental temperatures, also being particularly beneficial for the human body, it is also called “ray of health” and for this reason, it is widely used in the medical field for rehabilitation therapies;
- Far Infrared Radiation is the farthest and nearest to the microwave band. It has a wavelength from 15 uM (20 THz) to 1000 pm (300 GHz) and is used especially in astronomy as suitable for observations below 250 K.
Currently the infrared radiation is used in a wide range of applications: for example, the production of equipment for night vision especially in the military field, while in the civil field, the view through the smoke in case of fire since the smoke is transparent to infrared, night vision video surveillance, spectroscopy for the analysis of industrial materials, data transmission such as remote controls for televisions, communication between portable and fixed electronic devices like computers and mobile phones through special data transmission standard such as IrDA (Infrared Data Association).
The thermographic camera
The thermographic camera, more commonly called thermal imager, is a modern device particularly sensitive to infrared radiation composed from the set of optical and electronic elements capable of converting the energy emitted by a given object in the form of infrared electromagnetic waves into a digital signal. Through this procedure it is possible to obtain a thermal map of the surface temperature, which is then made visible by means of a display. This type of device uses a system of false colors that are attributed to variations in temperature and operates on the infrared spectrum between the medium wave infrared (MWIR) and the far infrared (FIR). It can be used to perform:
- Quantitative measures, to measure the absolute temperature of the surface at any point of the object under examination;
- Qualitative measures, to display the temperature distribution on the whole surface of the object under examination .In this case the images obtained are processed by means of a specific software that provides to carry out the analysis of the measures, the recording in time, the realization of relationships, with an acquisition frequency of thermographic images up to 60 Hz for the standard equipment and up to more than 400 Hz for the more sophisticated equipment and laboratory.
In practice, the thermographic camera is a non-invasive device that allows for measurements defined NDT (Non Destructive Testing) with which you can measure, display, store and process time temperature distribution over large surfaces quickly, accurately and in absolute safety.
The operation of this equipment can be summarized as follows.
An optical device, usually consisting of lenses germanium or silicon transparent to infrared radiation and equipped with anti-glare features, provides to frame objects of which you want to detect the infrared energy emitted and sends the image to a suitable matrix sensor. This sensor reads the image through a matrix formed by a given number of pixels (the element that can detect the smallest variation in the infrared in function of a certain temperature) for a given number of rows. For example, the most technologically advanced thermographic cameras are able to obtain images with a resolution of 640×480 pixels, this means that the thermal image is obtained as if they were employed 307200 contact thermometers at the same time.
An electronic circuit reads and processes quickly the value of energy stored by each pixel through adequate IT support and very complex algorithms. The signal resulting, is processed electronically and converted into a thermal image called thermogram, visible on a screen in general liquid crystal display (LCD) in which different shades of gray or colors are made to correspond to the distribution of the infrared radiation on the surface of object framed by the lens. In practice, a color is associated with each temperature value detected. This color is chosen from a given chromatic scale made available by the camera or the software of data processing. In most cases, the chromatic scales most used are the “rainbow” for the thermograms in construction and “iron” for industrial thermograms.
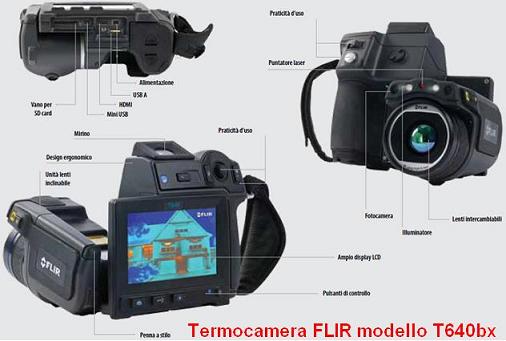
The matrix and especially the sensor are the basic elements of a thermographic camera. They directly affect all the features of the instrument. For general applications, flat matrix microbolometric sensors are used and they can be or cooled either uncooled. Cooled sensors obviously have a thermal sensitivity significantly higher than non-cooled. The most common material for the construction of the sensors is the amorphous silicon or vanadium oxide. The most sophisticated thermographic camera models can also store, store, process through appropriate supports and send a report of distance data collected over time.
Figure 5 shows a model of FLIR thermal imaging camera with highly advanced features such as resolution 640×480 pixel LCD touch screen 4.3 “, auto focus, laser pointer, Wi-Fi connectivity, an accuracy of ± 2 ° C, measures 650 ° C, creating documents in PDF, ability to add annotations via touchscreen keyboard and voice comments via Bluetooth headset.
As the main purpose of a thermographic camera is not to perform temperature measurements but to carry out a thermal analysis for comparison, in order to identify the type of instrument most suited for a particular thermographic measurement is necessary to know and evaluate the following parameters characterizing a thermographic camera:
- temperature range, the temperature scale within which it is expected to detect the thermal images, typically from -20 to 250 ° C;
- temperature resolution, the maximum difference in degrees that the sensor can perceive relatively the same image. This parameter should not be confused with the thermal accuracy. The latter is the measurement accuracy with respect to the absolute temperature scale. In general, the temperature accuracy is 2% in the thermographic camera that is pretty low. This is because the primary objective is not the absolute measure of temperature with these tools, but through a good thermal resolution, the objective is to obtain an image from which to perform a comparative analysis;
- geometric resolution of the sensor, generally this parameter coincides with the number of pixels that compose the matrix, ranges from 4×4, 16×16, 120×120, up to 160×160, 200×150, 320×240, to arrive at a maximum of 680×420; obviously the larger the geometric resolution the better the ability to represent thermally the object under examination
- spectral band of the sensor, the area of the infrared radiation that the thermographic camera can analyze. the most suitable and used for electrical and electronic applications is the long-wave LWIR;
- frequency of acquisition of thermal images from the sensor, this parameter is very important in the case of measures in motion such as rotating organs of a motor or as a result of excessive movements of the operator. In these cases, a low frequency of acquisition would further the phenomenon known in the optical “smearing” (a movement which degrades the sharpness) that prevents obtaining accurate temperature measurements. Typically, cameras with thermal imaging acquisition frequency below 33 Hz can be used successfully only for static surveys and placed on special stands, those with frequency up to 60 Hz can be used successfully for electro pads and those with frequency over 60 Hz to 2 kHz may be used for structural reliefs.
The thermographer
As modern thermographic equipment may be technologically advanced and extremely simple to use, they alone are not enough to properly run a thermographic measurement.
To successfully run a thermogram in fact you have to be aware of a wide range of technical knowledge related to the field of use, such as in construction, mechanical or electrical engineering and electronics. But in a special way you must be aware of the concepts of optics, for example in function of the lens used and the distance from the object, you can obtain different shots and therefore different sizes of objects detectable and measurable, but above all you will have to have a good knowledge of thermodynamics, which is the science that studies the thermal energy or heat in all its uses and transformations.
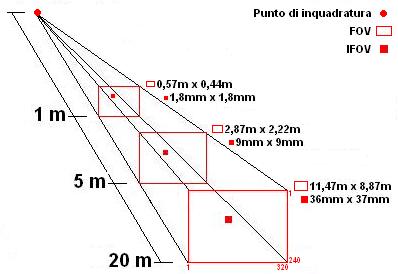
For example, you have to think about the evaluation of a field of view FOV (Field Of View) and as a result of an instantaneous field of view IFOV (Instantaneous Field Of View) which corresponds to the smallest detail detectable. Because the FOV and consequently the IFOV, increases with increasing distance of the object from the objective, you should carefully evaluate the size of the object to be analyzed which, in order to obtain sufficiently precise and technically valid must be much larger than a pixel of the thermographic camera. Figure 6 shows the different thermal images obtained as a function of FOV and IFOV with a resolution of 320×240 pixels and an objective with standard features.
Another example is related to the perfect knowledge of the fundamental laws of thermodynamics such as the concepts of conduction, convection and radiation as well as the emissivity and reflection. A material that has an emissivity factor of equal to or less than 0.6 has a high reflection factor, in this case the results of the thermogram must be interpreted with care as in the relief of temperature need to take into account also reflected temperature.
In a thermographic measurement also you should carefully evaluate the air which is the means interposed in the survey operations. You should be borne in mind that the air compared to infrared radiation has areas of transparency mixed with others that have strong attenuation. The air is sufficiently transparent up to distances of several meters, problems can arise in remote analysis as reliefs of high voltage power lines where it is necessary to perform measurements with different infrared wavelengths.
The professional who has the appropriate expertise to perform properly certified thermographic analysis, which falls into the category of NDT (Non Destructive Testing), is the thermographer.
The Italian Treccani encyclopedia defines the NDT as “those sets of tests and surveys that are done on metallic and non-metallic, designed to detect and/or measure and/or determine their composition and characteristics, defects and structural discontinuities, and including a diagnosis and research into the causes of failure of structures, objects, assemblies, installations, artefacts, systems, etc.. All of this happens without any destruction or removal of material (from which the definition), even at the microscopic level and without compromising the functionality of the component”.
The ideal figure to assume the status of a thermograph, in relation to plant power, can only be the professional who has the necessary technical skills mainly electrical and / or electronic and in-depth knowledge of all the components, ie the designer or installer. Currently, however, there are standards for which it is requested explicitly qualification or certification thermographer. At present, the certificate as thermograph is required only for the technical expertise of the Tribunal and for audits of public facilities. However, since the NDT are classified as “special processes” it is necessary that the staff is qualified and certified. In this regard, there are two main standards of certification for the qualification of thermograph:
- European standard UNI EN ISO 9712 of 2012 provides that the operators are qualified only by authorized third parties including the CICPnD (Italian Committee for the Coordination of Non-Destructive Testing), the RINa. (Italian Shipping Register), the IIS (Italian Institute of Welding). This legislation provides for three levels of qualification and passing an exam for each method of control for which you want to qualify:
- Base I level: he can carry out thermographic survey in accordance with precise written instructions or under the supervision of qualified personnel of II and / or III level;
- Intermediate II level, he can make a thermographic survey independently and can sign and certify technical expertise;
- Advanced III level, he is able to perform the complete design of a thermographic measurement, the methods, the execution time as well as the choice of the right tools. He can also coordinate the personnel level I and II;
- American Standard ASME (American Society of Mechanical Engeeners) provides that operators are qualified according to the recommendation of SNT-TC-1A issued by ASNT (American Society for Non-Destructive Testing). This legislation provides that operators are qualified only by the employer. This should define the conditions adopted for the qualification of personnel with a written procedure (Written Practice) in accordance with the recommendation of SNT-TC-1A. This certification is only valid to the working areas of the company that issued the certificate, and it is no longer valid when it comes to an end the employment relationship. Also this legislation provides for three levels of qualification: the base I level, intermediate II level, advanced III level.
The electrical maintenance with the thermographic camera
One of the areas in which it is clear the advantage of using thermography, is the maintenance in the field of electrical systems where the passage of electric current through the wires and / or components such as distribution panels, transformers, circuit breakers, motors, capacitors, etc., causes a heating due to the Joule effect (P = I2·R).
Analyzing the phenomenon in thermographic terms, the presence of hot spots due to this heating indicates a corresponding higher current density or a higher contact resistance. These factors lead to an increase in the power dissipated into heat. In the case where the heat dissipated reaches an excessive value such as to seriously endanger the proper functioning of the equipment and of the connection cables, it is very difficult to detect the heat with the naked eye or with traditional instruments such as thermometers because, especially in plants of high power, to perform temperature measurements in contact wires and / or bars and / or rotary axes is hard to apply and especially very dangerous for the operator’s safety.
It is for these reasons that in order to achieve more accurate and reliable it is advisable to perform thermal analysis only after taking the electrical system running at full load for at least an hour.
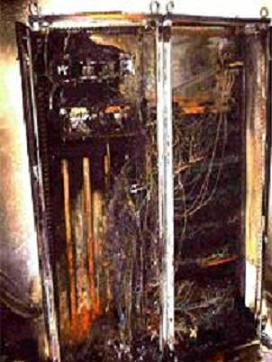
through the use of a thermographic camera, is an absolute essential for planning proper preventive maintenance and / or corrective identifying possible weak points of the system and equipment. Currently even the majority of insurance companies are very interested in the use of thermographic instruments offering policies more favorable to all those companies that demonstrate the use of this technique to prevent failures with appropriate reports. The timely identification of a hot spot (hot spot) in a cable connection, in a terminal, in a bar or in any component within an electrical switchboard, it can avoid the consequences visible in Figure 7.
Below is a list of the main uses of thermography in the electricity sector:
- control of electrical conductors used in the production and distribution of electricity;
- testing the components of an electrical system such as circuit breakers, transformers, switchgears, cable joints and terminals;
- detection of abnormal overheating due to increase of the contact resistance or malfunction of components;
- identification of “hot spots” within distribution boards;
- superheat control in the distribution busway to-rail;
- detection of overheating of the fuse;
- identification of under-sizing of cables;
- control of electromechanical systems.
In the context of electrical systems, all possible modes of application of thermographic cameras can be divided into two broad categories: applications for high-voltage and low-voltage applications.
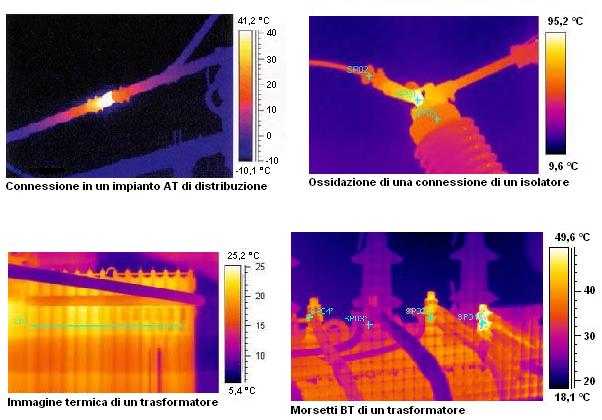
– Applications for high voltage, in this area you can detect: oxidation and overheating of switchgears and switches, overheating and tightened connections and terminals, fault isolators (some examples in Figure 8);
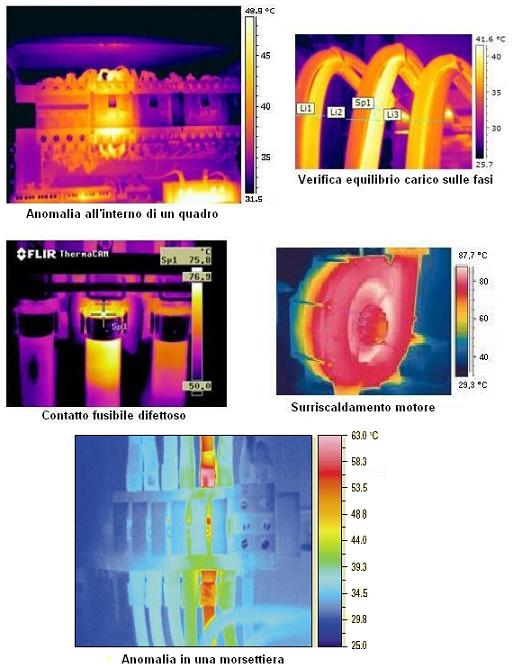
– Applications for low voltage, in this area you can do the following: verification of terminal blocks, wiring, cables; verification of connections and contacts; verification the balance of the load on the phases; verification the fuses; verification of electric motors (some examples in figure 9 and 10).

Some Useful Tips
Never thermographic measurements through the glass which is a substance opaque to infrared radiation. In this case the thermographic camera only measures the surface temperature of the glass and not that present behind it, on the contrary, the sun’s rays pass through the glass and could alter the surface temperature of the measured object such as a switchboard or a motor .
In order to obtain a correct thermal image, correct environmental conditions are are extremely important. These should be as stable as possible, in practice, temperature and presence of various objects in the environment of measurement should not change. In this regard, you should comply with the following conditions before and during the measurement:
- Absence of direct sunlight;
- No wind or air currents;
- Exact knowledge of the emissivity of the surface of the object to be measured;
- In order to identify and to evaluate the contribution of possible reflections you have to detect multiple thermal images of the measured object from different angles;
- Keep the area of the smaller size of the object of measurement. For this purpose choose a measurement distance as small as possible and especially to evaluate and screen all possible sources of interference;
- In the case of periodic maintenance you need to document all the specific environmental conditions and measures in order to use them for later analysis;
- For greater operator safety and a better measurement of the details it is advisable to use a suitable stand for fixing the thermographic camera.
Conclusion
From the foregoing, in order to perform an effective preventive and corrective maintenance in electric field, there is no doubt that the use of thermographic instruments should be considered absolutely necessary, with the application of the thermographic techniques is in fact possible to obtain the following advantages :
- Produce an image that is equivalent to the use of thousands of thermocouples or pyrometers;
- Measure and process the temperature of any component of electrical and electronic over time, without the need for any direct contact;Measure and analyze the temperature in hazardous areas over time, such as primary distribution panels, MV / LV transformers, transformer stations, large industrial equipment;
- Produce thermograms with the appreciation of differences in temperature of the order of hundredths of a degree;
- Identify materials and faulty components before they reach a state of danger, reducing the risk of events such as fire or sudden blocks of production;
- Making temperature measurements with plants at full capacity without interruption of electricity;
- Detect in real time the surface heat produced by any equipment and / or electrical and electronic component with ability to save, edit and send away a huge amount of data.
On the other hand there are the following limitations:
- Often it is necessary to shield the camera from the thermal environmental emissions;
- The need for a skilled operator to correctly interpret the images detected;
- The cost is still too high.
Concluding this brief discussion on the use of thermography in electric field, it is possible to say that despite the use of a thermographic camera involves an investment of great importance both for the cost of the equipment and for those relating to the formation of a specialized operator, the advantages that can be gained from such activity will produce savings which will easily cover your expenses.