In this series of articles we will learn how to create a Web Dendrogram using the D3 graphics library.
Dendrograms are a very useful graphical tool for group analysis (cluster analysis or clustering). The Dendrogram is essentially a tree graph.
It starts from a point of origin, the root, (root) from which you depart branches (links) that end in nodes (nodes); From these knots, in turn, will depart other branches that will also end in knots, and so on, until they arrive at terminal nodes, from which no branch is left, called leaves.
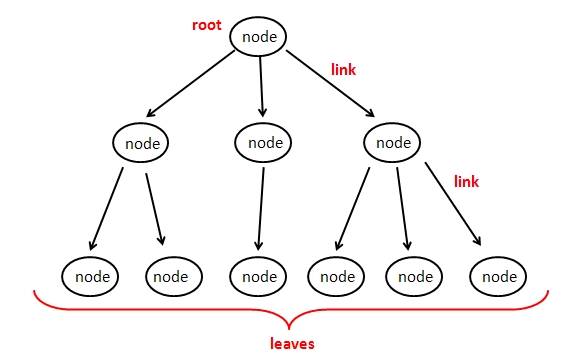
(Note: For simplicity I used arrows, in fact the tree is an unoriented graph).
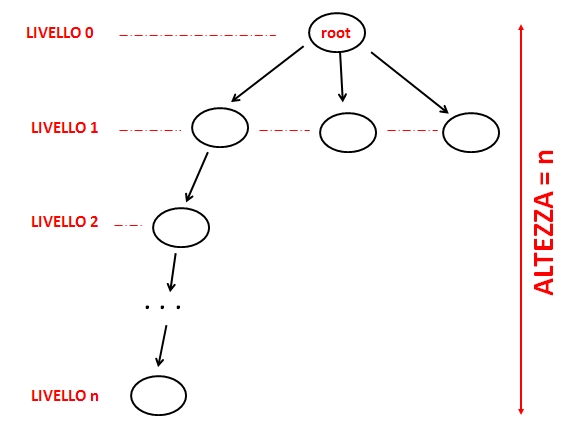
These tree structures represent structures at hierarchical levels, where starting from the root, which we define at level 0, each generation of nodes will define a next level (Level 1, Level 2, until you get to the N-1 level of the leaves, where n is Called the depth of the graph.
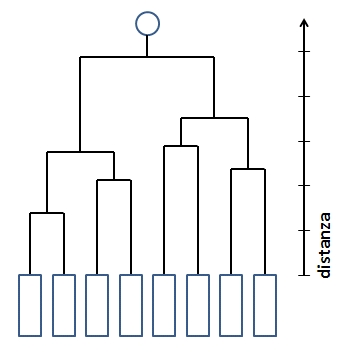
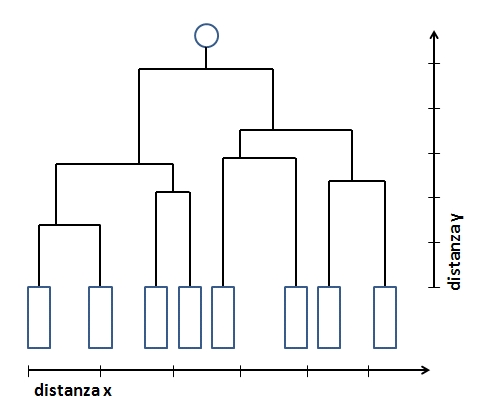
The Dendrogram, in particular, is the result of an algorithm or hierarchical method, in which in addition to the hierarchical structure, with the subsequent allocations in the various levels in n units, is also reported the level of ultrametric distance.
Each branch of the Dendrogram corresponds to a group or cluster while the partition nodes in two or more branches identify the distance level at which the various clusters merge.

There are various methodologies for calculating distances between different groupings, including the Centroid method, which I covered in the book Beginning Javascript Charts with Jqplot, D3 and Highcharts, (2013) apress. Other methodologies are:
- Single Bond method
- Complete Bonding method
- Medium Bond method
- Ward method
- Centroid method (already mentioned)
Most likely, in future articles I’ll discuss these various methods in detail. However you can find on the net (quite easily) algorithms already implemented in different programming languages.
As a starting point I made reference to the example Dendrogram of M. Bostock (the creator of Library D3) #4063570 (http://bl.ocks.org/mbostock/4063570).

In fact, if you pay attention, the example is not a dendrogram, but a simple tree structure. In fact, the nodes for each level are all aligned on the same vertical and therefore the ultrametric distances are not contemplated at all. In the examples that we will develop in this series of articles, we will implement all the necessary code to be able to realize real dendrograms in which the distances are also contemplated in the visualization.
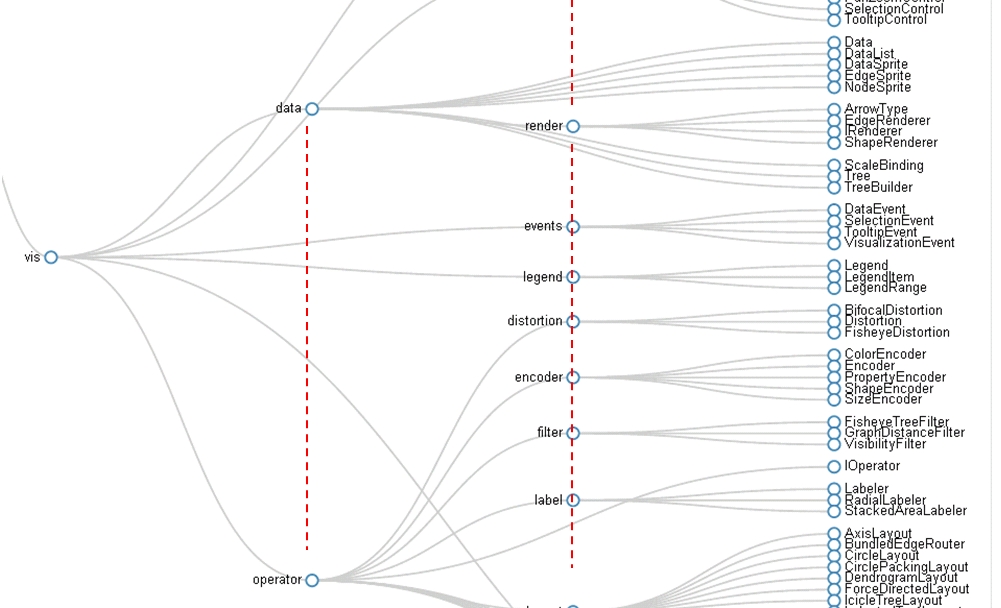
Therefore, the representation carried out in the Bostock example shows only hierarchical and grouping information (qualitative approach), but does not take into account the distances with which these clusters are distanced from each other ( Quantitative approach).
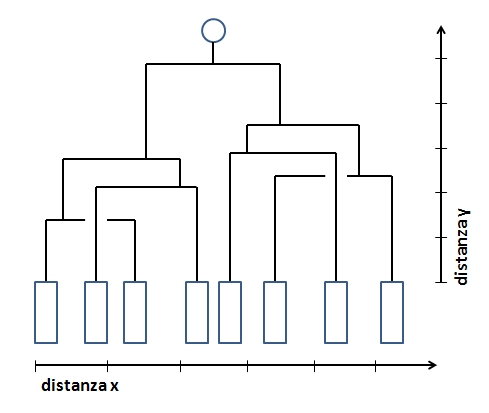
But it does not end here, in the last example, we will introduce an additional distance, which quantifies in an alternative (and supplementary) way the distance between the various clustered elements, that is the leaves. In This case the Dendrogram leaves will no longer be uniformly represented at the same distance, as the partitions of the branches for each parent node will no longer be symmetrical.
Taking into account this further peculiarity it is possible to obtain also overlapping branches. Probably in this case the clustering was not made on the basis of the distribution of the leaves along the x distance (since the clusterization should be based on the similarity of the samples).
But now let’s start with the first example of a dendrogram. First we will implement a tree structure in everything similar to that of the Bostock example, but much simpler, so as to better focus on the basic aspects of what we are developing.
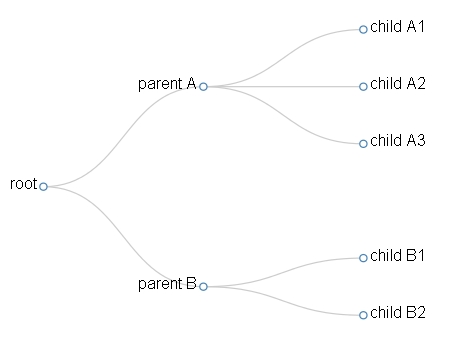
As we can see the structure is two-tiered (more than root) and I appropriately labeled each node with the corresponding role within the tree structure.
This tree structure should be written in a specific format, so that it can be readable by the JavaScript code we are about to implement. What better format if not JSON?
So with any text editor, let’s write the tree structure in the JSON format Fig. 8 and then save it as DENDROGRAM01. Json.
{   "name": "root",
    "children": [
            {"name": "parent A",
             "children": [
                   {"name": "child A1"},
                   {"name": "child A2"},
                   {"name": "child A3"}
             ]
            },{"name": "parent B",
             "children": [
                  {"name": "child B1"},
                  {"name": "child B2"}
             ]
            }   ]
}
In the next article we will conclude this example, developing within an HTML page the code necessary to correctly read the data contained in the newly written JSON file, and to represent a tree based on the data entered.