jqPlot is free and open source. It was developed by Chris Costello in 2009. It is possible to download it from the official site and it does not require any registration. With a few code and very easily, it is possible to develop all the most common charts in our web page: bar charts, histograms, line charts, pie charts, log and semilog, etc. In short, anything which is normally used to visualize the data (just think to the graphics available on Microsoft Excel) is already implemented within the library. You only need to insert the input data (x,y,z, etc.) and define all the options which characterize the chart (color, shape, orientation, title, legend, etc.). These options are defined within a JavaScript construct which is almost always the same for each type of chart..
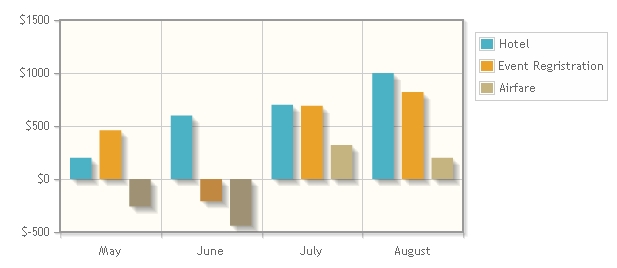
The greatness and the power of this library, as far as i can say, is its ease and speed in producing great results.
It is the optimal choice:
- for those who do not have much time to devote to programming;
- for those who are beginners;
- for those who want to immediately get fast and excellent results;
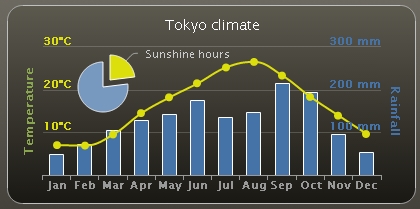
Highcharts is a commercial library (it is not freeware for professional purposes) but you can download it for free from the official site. It is very similar to the jqPlot library and in it, you can find many of jqPlot constructs. In fact, even with this library you can get fast and excellent results only by assigning the input data and defining the options for representing the chart. However, being a commercial product, this library provides more functionalities than jqPlot.

D3 is a free and open source library, developed in 2011 by Mike Bostock (in collaboration with Heer and Ogievetsky). It is directly availabel from the official site. This library, actually, compared to the other two libraries, is not aimed to drawing charts, but it has a wider field of application: the data visualization through graphical elements (that is to say so, it seems the same thing, but once examined the topic, it is not at all). In fact, here already implemented charts do not exist, but instead, the input data must be converted in basic graphic components. These components are built using SVG and then they are grouped in order to drawing a more general graphical representation ( it could be a bar chart too, of course). Thus, if we want to draw a chart, for example a barchart, we have to implement every components, one by one, separately (bars, title, axes, labels, etc) and then assemble all of them.
Thus, there are no limits to what we can represent and draw with this library. However, we should take into account that the number of rows of code grows with the complexity of what we want to represent.
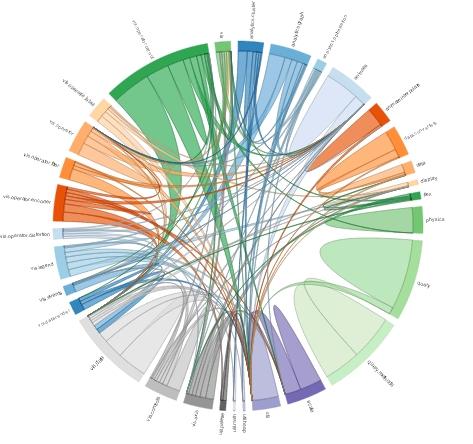
The greatness and the power of this library, as far as i can say, is the ability to fully exploit the potential of the SVG technology using only the JavaScript language. This allows you to add interactivity and animation to graphic elements.
It is an optimal choice:
- for those who need to visualize data in an innovative way;
- for those who are experts in programming;
- for those who want to have more control on each graphical component.