Welcome, jqPlot user!
In this post we will see how to make a real-time data chart using the jqPlot library.

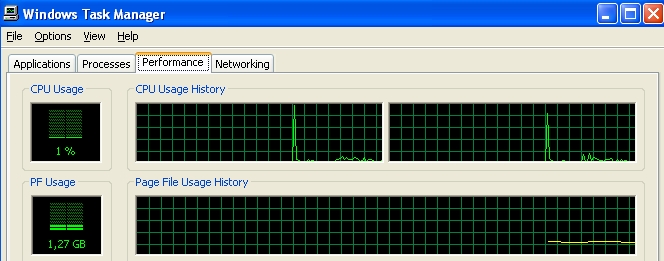
This type of chart is particularly useful when you are performing a direct reading. The real-time charts are really essential when we need to monitor the trend over time of a physical property, an amount, or a variable in general. For example, we can see a real-time chart when we open the Windows Task Manager in order to monitor the CPU Usage percentage, or the physical memory usage, etc. (see Fig.1).
These charts are characterized by the fact that they are updated at regular interval of time, ranging from a few seconds to even hours, days. This depends on the index of variability of the observed physical quantity. We can see other cases, for example, by monitoring the outdoor temperature variation during the day, or by following the trend of a particular stock index, or more. Because of the utility of a such visualization data, it is important to know how to develop a real-time chart. Using the jqPlot library, we can do it so very easily.
In the book which i recently wrote, Beginning JavaScript Charts with jqPlot, Highcharts and D3, ed.Apress (2013), in addition to many other examples, the topic of real-time data is further discussed, using both the jqPlot library and the D3 library. I highly recommend to read the chapters 17 and 26 of the book to those who wish to learn more.
But now, let’s start to implement the real-time chart. Let’s start looking at the JavaScript code within the following HTML page.
<HTML>
<HEAD>
<!--[if lt IE 9]>
<script type="text/javascript" src="http://cdn.jsdelivr.net/excanvas/r3/excanvas.js"></script>
<![endif]-->
<script type="text/javascript" src="http://code.jquery.com/jquery-1.9.1.min.js"></script>
<script type="text/javascript" src="http://cdn.jsdelivr.net/jqplot/1.0.8/jquery.jqplot.min.js">
</script> <script type="text/javascript" src="http://cdn.jsdelivr.net/jqplot/1.0.8/plugins/jqplot.dateAxisRenderer.min.js"></script>
<link href="http://cdn.jsdelivr.net/jqplot/1.0.8/jquery.jqplot.min.css" rel="stylesheet" type="text/css" /><script type="text/javascript">

$(document).ready(function(){
    var t = 2000;
    var x = (new Date()).getTime();
    // current time
    var n = 20;
    data = [];
    for(i=0; i<n; i++){
        data.push([x - (n-1-i)*t,0]);
    }
    var options = {
        axes: {
            xaxis: {
                numberTicks: 4,
                renderer:$.jqplot.DateAxisRenderer,
                tickOptions:{formatString:'%H:%M:%S'},
                min : data[0][0],
                max: data[data.length-1][0]
            },
            yaxis: {
                min:0,
                max: 1,
                numberTicks: 6,
                tickOptions:{formatString:'%.1f'}
            }
       },
       seriesDefaults: {
           rendererOptions: { smooth: true}  }
       };
       var plot1 = $.jqplot ('myChart', [data],options);
       $('button').click( function(){
           doUpdate();
           $(this).hide();
       });
       function doUpdate() {
            if(data.length > n-1){
                 data.shift();
            }
            var y = Math.random();
            var x = (new Date()).getTime();
            data.push([x,y]);
            if (plot1) {
                 plot1.destroy();
            }
            plot1.series[0].data = data;
            options.axes.xaxis.min = data[0][0];
            options.axes.xaxis.max = data[data.length-1][0];
            plot1 = $.jqplot ('myChart', [data],options);
            setTimeout(doUpdate, t);
       }
});
</script>
<div id="myChart" style="height:300px; width:500px;"></div>
<button>Start Updates</button>
</BODY>
</HTML>
Note: if you are interested you can edit the code directly on Web, without using editors on your PC. You can observe how your changes affect the behaviour of the chart. This can be done visiting the JSFiddle link:http://jsfiddle.net/meccanismocomplesso/QAr4r/ where you will find the whole code and do all your tests.
If you load the HTML page on your browser you see a chart as shown in Fig.2, a line chart with all its point to zero along the y-axis. A time scale is reported on the x-axis where the values are shown in the hours-minutes-seconds format.
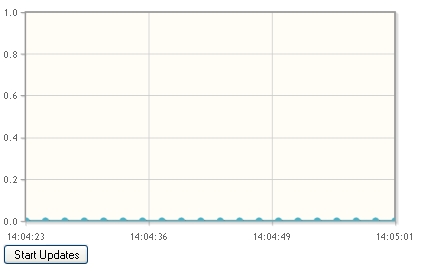
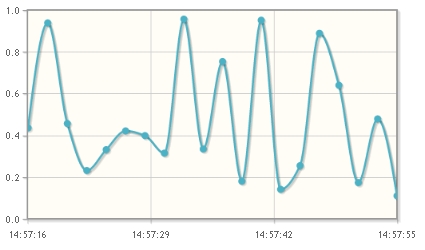
This is the situation before starting the acquisition of data. At this time the chart is not acquiring any data. In order to start the acquisition of data with the consequent updating, we have to press the button “Start Updates” in the lower left corner. After that, the chart immediately begins to show a linear trend over time (a new point is shown every 2 seconds ). After about twenty seconds, your chart will be very similar to that shown in Fig. 3.
But now, let’s analyze the chart in detail looking at the JavaScript code. First of all, in this example we have chosen, for the sake of simplicity, to simulate the flow of data coming from an external source. We can do this by replacing the external source with a function which generates random values between 0 and 1.
var y = Math.random();
var x = (new Date()).getTime();
Thus, the acquisition times are stored in the x variable which receive the return value of the getTime() function. Meanwhile, the random values which are generated from the Math.random() function are stored in the y variable.
During the data acquisition, the pairs of values (x,y) are stored, in turn, value by value, in the data array. Thus, theoretically, proceeding with the readings, this data array grows indefinitely. Since we are only interested to a limited range of time for representing the data in the real-time chart, it is practically useless to store countless numerical values. Doing so, the points represented on the chart, would get gradually smaller and smaller, making unreadable the chart. Instead it is more wise to decide to keep only the last n samples. If we decide this, which is the need to store countless samples? For this purpose it is necessary to use a buffer.
var t = 2000;
//refresh time in millisec
var x = (new Date()).getTime();
// current time
var n = 20;
//buffer size (sample number)
var data = [];
//buffer
Thus, we indicate the sampling time with the t variable, the buffer with a data array and the amount of readings contained in the buffer with the n variable. When the buffer is full, then the eldest value will be erased in order to make place to the new acquired value. This allows us to always have an updated view on the last n data points. We can erase the eldest value stored in the data array using the shift() function.
if(data.length > n-1){
     data.shift();
}
whereas to store the new acquired point we use the push() function.
data.push([x,y]);Each time we make a new acquisition the chart must be updated and for accomplish that we need first to delete the chart from the page, then update data and options of the jqplot object with new values, and finally draw the chart again.
if (plot1) {
    plot1.destroy();
}
plot1.series[0].data = data;
options.axes.xaxis.min = data[0][0];
options.axes.xaxis.max = data[data.length-1][0];
plot1 = $.jqplot ('myChart', [data],options);
We delete the old chart with the destroy() function, then we update the jqplot object plot1 with the new buffer. In the options object we specify the two new max and min values of the x-axis. Finally we draw again the chart calling the $.jqplot() function.
With this we have terminate the code analysis. See you to the next article. Bye!