Kurtosis is a statistical measure that describes the shape of the distribution of a data set. Essentially, it indicates how much the tails of a distribution differ from those of a normal distribution. A kurtosis value greater than zero suggests heavier tails (more “pointed” distribution), while a lower value indicates lighter tails (more “flat” distribution). Kurtosis can be positive (the tails are heavier), negative (the tails are lighter), or zero (similar to a normal distribution).
[wpda_org_chart tree_id=16 theme_id=50]
Kurtosis
The kurtosis of a distribution can be calculated using the following formula:

where:
 is the number of observations in the distribution,
 are the individual observations,
 is the mean of the distribution.
This calculation provides a numerical value that represents the kurtosis of the data distribution. A result of 3 indicates a normal distribution, while values above 3 indicate heavier tails (more “spiky” distribution), and lower values indicate lighter tails (more “flatter” distribution).
Calculating kurtosis in data analysis provides information about the shape of the data distribution. This measure is useful for understanding the tendency of data to have heavier or lighter tails than a normal distribution.
- Shape of Distribution: Kurtosis helps identify whether the distribution of data is more “spiky” (positive kurtosis) or more “flat” (negative kurtosis) than a normal distribution.
- Outliers: A high kurtosis value may indicate the presence of outliers or extremes in the distribution. This can be important to recognize any anomalous points in the data.
- Statistical decisions: Kurtosis can influence statistical decisions. For example, in some statistical tests, the assumption of normality of the distribution may be important, and kurtosis can help evaluate this normality.
In summary, kurtosis provides a measure of the “heaviness” of the tails of the distribution, contributing to a deeper understanding of the structure of the data and supporting analytical or modeling decisions.
In more discursive terms, kurtosis, considered alongside other descriptive statistics and data analysis tools, offers an opportunity to explore the overall shape of a distribution. This is crucial because, while the mean and standard deviation give us information about the location and central dispersion of the data, kurtosis goes further, helping us understand how common or rare extreme events are. This ability to reveal the presence of heavier or lighter tails in the distribution is particularly useful in situations where understanding variability and identifying data outliers are crucial, such as in financial analysis or more complex statistical decisions.

Recommended Book:
If you are interested to this topic, I suggest to read this:
Kurtosis calculation example
You can use the scipy library in Python to calculate the kurtosis of a data set. Here is an example of how to do it:
import numpy as np
from scipy.stats import kurtosis

# Generate a sample dataset
data = np.random.normal(size=1000)

# Calculate the kurtosis
kurtosis_value = kurtosis(data)

print(f"Kurtosis of the dataset: {kurtosis_value}")
You will get a variable result (the data is randomly generated) similar to the following:
Kurtosis of the dataset: 0.02330805973832817In this example, numpy is used to generate a set of random data with a normal distribution, and scipy.stats.kurtosis calculates the kurtosis of this data. The result is then printed on the screen. Remember that the kurtosis value alone may not be very interpretive, but should be interpreted in relation to the context and expectations of your data analysis.
Using the Kurtosis calculation and examples
Here are some key points about kurtosis and its use:
- Distribution form:
- Positive Kurtosis: Indicates that the tails of the distribution are heavier than a normal distribution. This means there is more extreme data.
- Negative Kurtosis: Indicates that the tails of the distribution are lighter than a normal distribution. This means there is less extreme data.
- Comparison with the normal distribution:
- A normal distribution has a kurtosis of 3. A value greater than 3 indicates heavier tails, while a lower value indicates lighter tails.
- A normal distribution has a kurtosis of 0 when using the definition “excess kurtosis,” which subtracts 3 from the raw value.
- Identification of outliers:
- High kurtosis values may indicate the presence of outliers or extremes in the distribution. This can be useful for identifying anomalous data.
- Statistical decisions:
- In some statistical analyses, the assumption of normality of the distribution is important. Kurtosis can help evaluate whether this assumption is valid.
- Financial risk model:
- In finance, kurtosis can be used to assess the risk of financial returns, as heavier tails indicate a greater probability of extreme events.
In general, kurtosis provides insight into the shape of the distribution and can be useful in understanding variability and outliers in data, influencing statistical decisions and modeling. It should be noted that kurtosis alone may not be sufficient to draw definitive conclusions, and is often considered in conjunction with other descriptive statistics and data analysis techniques.
Example of analysis on the shape of distributions
Certainly! We will use the matplotlib library to visualize data distributions and scipy.stats to calculate kurtosis. Make sure you have both libraries installed by running:
pip install matplotlib scipyHere is an example of analysis of the shapes of the distributions:
import numpy as np
import matplotlib.pyplot as plt
from scipy.stats import kurtosis, skew, norm
# Generates data from a normal distribution
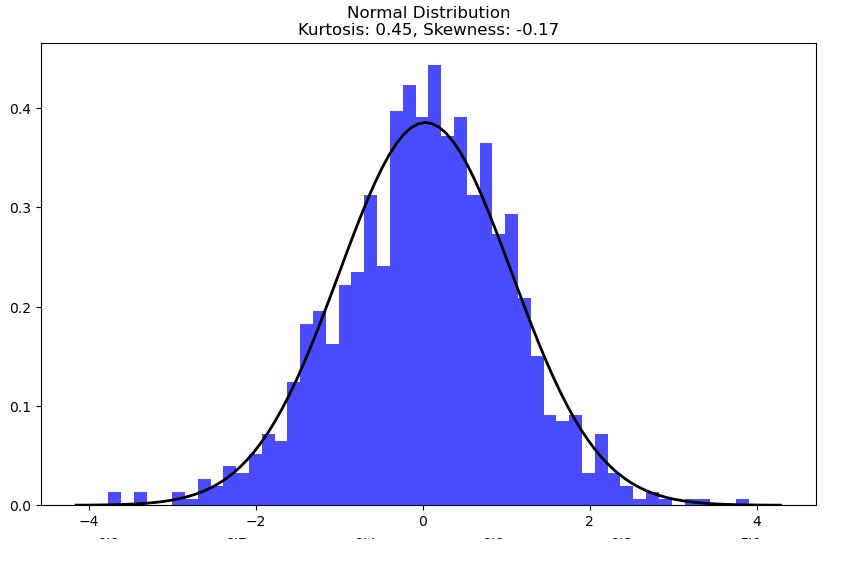
data_normal = np.random.normal(size=1000)
# Generate data from a distribution with heavier tails (positive kurtosis)
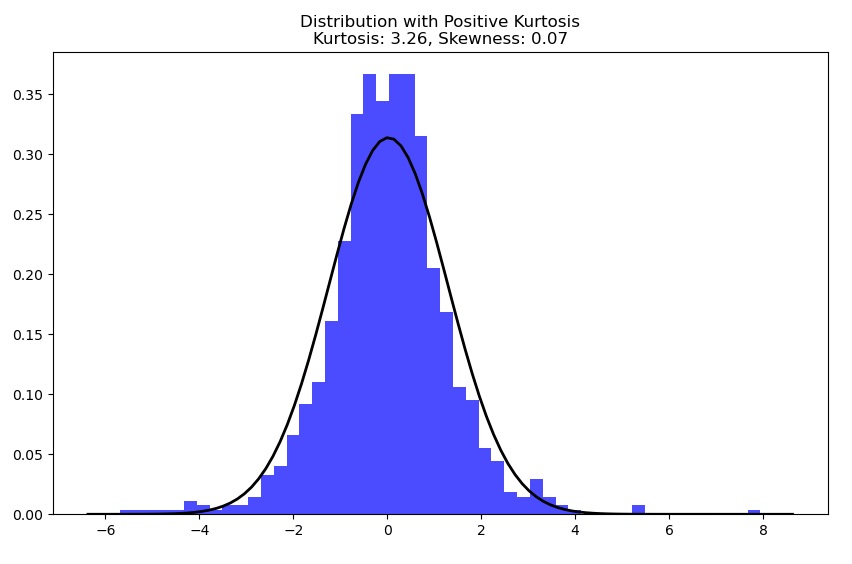
data_heavy = np.random.standard_t(df=5, size=1000)
# Generate data from a distribution with lighter tails (negative kurtosis)
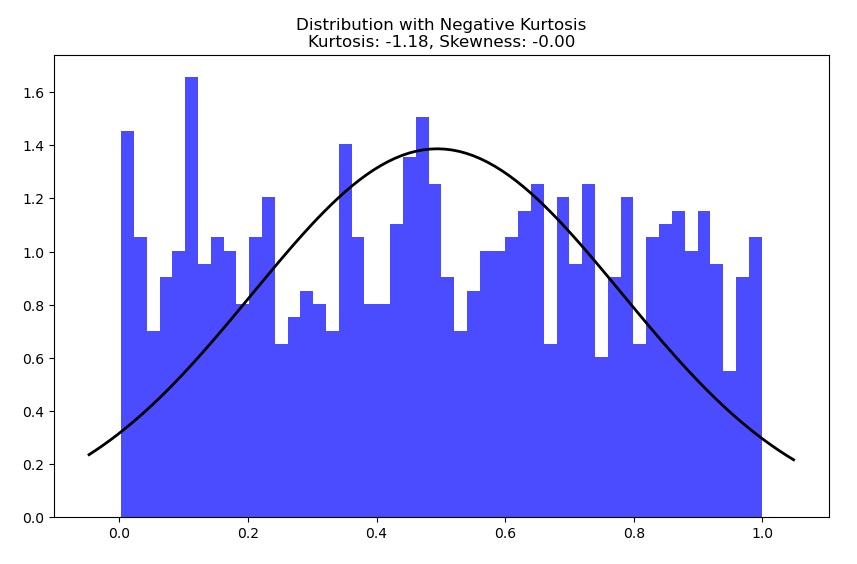
data_light = np.random.uniform(size=1000)
# Function to show the distribution and calculate kurtosis and skewness
def analizza_distribuzione(data, title):
plt.figure(figsize=(10, 6))
# View the histogram of the data
plt.hist(data, bins=50, density=True, alpha=0.7, color='blue')
# Displays the probability density function of the normal distribution
xmin, xmax = plt.xlim()
x = np.linspace(xmin, xmax, 100)
p = norm.pdf(x, np.mean(data), np.std(data))
plt.plot(x, p, 'k', linewidth=2)
# Calculate and print kurtosis and skewness
kurt = kurtosis(data)
skewness = skew(data)
plt.title(f'{title}\nKurtosis: {kurt:.2f}, Skewness: {skewness:.2f}')
plt.show()
# Analyze the three distributions
analizza_distribuzione(data_normal, 'Normal Distribution')
analizza_distribuzione(data_heavy, 'Distribution with Positive Kurtosis')
analizza_distribuzione(data_light, 'Distribution with Negative Kurtosis')In this example, we are generating three data sets: one from a normal distribution, one with heavier tails (t-distribution with low degrees of freedom), and one with lighter tails (uniform distribution). The analyze_distribution function displays the histogram of the data, overlays the probability density function of the normal distribution, and calculates kurtosis and skewness, providing a visual and numerical analysis of distributions.

If you want to delve deeper into the topic and discover more about the world of Data Science with Python, I recommend you read my book:
Fabio Nelli
The first is a normal distribution since its Kurtosis value is close to zero.
The second distribution, however, has a positive kurtosis value and therefore the central values of the distribution will be greater in number than a normal distribution.
The third distribution, however, has a negative kurtosis value and therefore the values will be more distributed across the entire range of the distribution with a consequent widening of the tails compared to a normal distribution. With increasingly higher values there will be a tendency towards a uniform distribution.