This is the third in a series of articles illustrating how to develop a dendrogram, using the D3 JavaScript Library, built on the basis of a particular data structure contained within a JSON file.
Read the article:
- How to make a dendrogram with the D3 Library (Part 1)
- How to make a dendrogram with the D3 Library (Part 2)
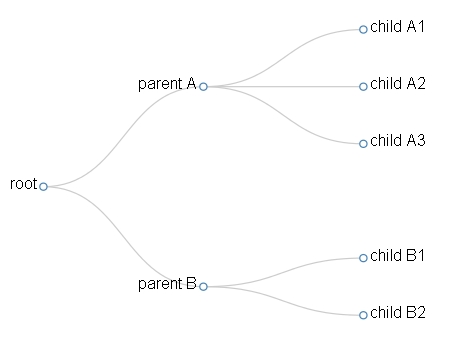
In the previous article we made a simple tree structure.
In this article, we will expand the previous example by converting it into a real dendrogram, in which we also take into account the ultrametric distance between the various nodes.
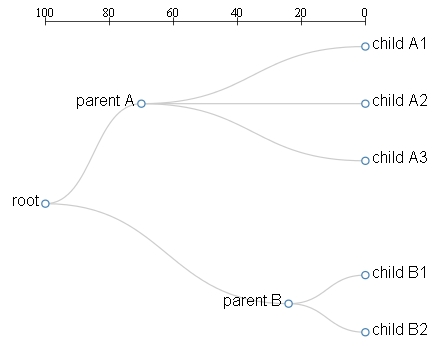
In Figure 2, we can see that the two parent nodes are no longer aligned with each other even if they belong to the same level (Level 1). The position of the two relatives nodes is not random, but is positioned at the distance value, scaled on the axis shown at the top of the figure.
In our example we will impose that the distance between all the leaves and the root is of 100, and that the distances between the leaves and the two nodes of partition are, respectively, 76 for Node A and 30 for node B.
We then begin to define a new data structure in a JSON file, saving it as dendrogram02.json. This file will be read from the D3 library and the data contained within will be interpreted to generate a dendrogram.
{   "Name": "Root", "Y": 0,
    "Children": [
          {  "name": "parent A",
             "y" : 30,
             "children": [
                  {"name": "child A1", "y" : 100},
                  {"name": "child A2", "y" : 100},
                  {"name": "child A3", "y" : 100}
             ]
           },{ "Name": "Parent B", "Y": 76,
               "Children": [
                  {"name": "child B1", "y" : 100},
                  {"name": "child B2", "y" : 100}
             ]
           }
      ]
}
Now that we have defined the structure we can write the Web page that will represent our dendrogram, saving it as dendrogram02. html.
<!doctype html>
<html>
<head>
<style>
.node circle {
     fill: #fff;
     stroke: steelblue;
     stroke-width: 1.5px;
}
.node {
     font: 20px sans-serif;
}
.link {
     fill: none;
     stroke: #ccc;
     stroke-width: 1.5px;
}
line { stroke: black; }
</style>
<script type="text/javascript" src="http://d3js.org/d3.v3.min.js"></script>
</head>
<body>
<script type="text/javascript">
var width = 600;
var height = 500;
var cluster = d3.layout.cluster()
     .size([height, width-200]);
var diagonal = d3.svg.diagonal()
     .projection (function(d) { return [x(d.y), d.x];});
var svg = d3.select("body").append("svg")
     .attr("width",width)
     .attr("height",height)
     .append("g")
     .attr("transform","translate(100,0)");
var xs = [];
var ys = [];
function getXYfromJSONTree(node){
     xs.push(node.x);
     ys.push(node.y);
     if(typeof node.children != 'undefined'){
         for ( j in node.children){ getXYfromJSONTree(node.children[j]);
         }
      }
}
var ymax = Number.MIN_VALUE;
var ymin = Number.MAX_VALUE;
d3.json("dendrogram02.json", function(error, json){
    getXYfromJSONTree(json);
    var nodes = cluster.nodes(json);
    var links = cluster.links(nodes);
    nodes.forEach(
        function(d,i){
           if(typeof xs[i] != 'undefined')
                  { d.x = xs[i]; }
           if(typeof ys[i] != 'undefined')
                  { d.y = ys[i]; } var xs = [];
var ys = [];
function getXYfromJSONTree(node){
     xs.push(node.x);
     ys.push(node.y);
     if(typeof node.children != 'undefined'){
          for ( j in node.children){
               getXYfromJSONTree(node.children[j]);
          }
     }
}
    });
    nodes.forEach(
         function(d){
            if(d.y > ymax) ymax = d.y;
            if(d.y < ymin) ymin = d.y;
    });
    x = d3.scale.linear().domain([ymin, ymax]).range([0, width-200]);
    xinv = d3.scale.linear().domain([ymax, ymin]).range([0, width-200]);
    var link = svg.selectAll(".link")
          .data(links)
          .enter().append("path")
          .attr("class","link")
          .attr("d", diagonal);
    var node = svg.selectAll(".node")
          .data(nodes)
          .enter().append("g")
          .attr("class","node")
          .attr("transform", function(d) { return "translate(" + x(d.y) + "," + d.x + ")"; });
    node.append("circle")
          .attr("r", 4.5);
    node.append("text")
          .attr("dx", function(d) { return d.children ? -8 : 8; }) .attr("dy", 3)
          .style("text-anchor", function(d) { return d.children ? "end" : "start"; })
          .text( function(d){ return d.name;});
    var g = d3.select("svg").append("g")
          .attr("transform","translate(100,40)");
    g.append("line")
          .attr("x1",x(ymin))
          .attr("y1",0)
          .attr("x2",x(ymax))
          .attr("y2",0);
    g.selectAll(".ticks")
          .data(x.ticks(5))
          .enter().append("line")
          .attr("class","ticks")
          .attr("x1", function(d) { return xinv(d); })
          .attr("y1", -5)
          .attr("x2", function(d) {return xinv(d); })
          .attr("y2", 5);
    g.selectAll(".label")
          .data(x.ticks(5))
          .enter().append("text")
          .attr("class","label")
          .text(String)
          .attr("x", function(d) {return xinv(d); })
          .attr("y", -5)
          .attr("text-anchor","middle");
});
</script>
</body>
</html>
Now we will comment out the parts of the code that we have added/modified from the previous example.
In the preceding example, we saw how by passing the JSON structure contained in the file directly to the cluster. nodes () function, the latter read the values of the name and children attributes specified in the file, automatically assigning them to Internal attributes of each single generated object node. In contrast to the X and Y attributes, the function calculates its value automatically, causing the coordinates assigned to each node to form an ordered tree. But this functionality does not interest us, indeed, to define a dendrogram we need the code to somehow read the values of distances (Y attribute) to be assigned to each node in the way we have defined them within the JSON file.
So it will be necessary to define a function that performs this work. We define two vectors xs and ys that contain the values of x and y read within the file (basically perform functions similar to arrays nodes and links). Then we implement a function, which we’ll call getXYfromJSONtree().
var xs = [];
var ys = [];
function getXYfromJSONTree(node){
     xs.push(node.x);
     ys.push(node.y);
     if(typeof node.children != 'undefined'){
          for ( j in node.children){
               getXYfromJSONTree(node.children[j]);
          }
     }
}
If you notice well, this is a recursive function (i.e. it calls itself inside). This function performs a function similar to that of clusternodes () and cluster. Links () only that instead of nodes and links, it will read the X and Y values contained in the JSON structure. Like the cluster. nodes () function, you pass the root node of the tree as an argument and then recursively check node by node (following the same read sequence of cluster. nodes ()) to generate a sequence of x, y values in the same order as the sequence Nodes contained in the nodes array. It is very important that this order is respected, to give a correct correspondence between the nodes contained in the array and the (x, y) coordinates.
If we did not specify a value for x and/or y within the JSON structure, the Getxyfromjsontree () function will not assign any values within the array element, leaving the “undefined” field. Next, we’ll handle those undefined values, considering, in these cases, the value that is automatically computed by cluster. nodes () is valid.
By introducing the values of distances, we are introducing a scale of values, on which we will then define a domain and a range. But to do this you need to know, in fact, the extension range of the values defined within the JSON file and above all it is necessary to do it dynamically (ie this range will vary depending on the values contained in the file and the Web page must Be able to handle any different eventualities.) So let’s define two variables Ymax and ymin, which will allow us to establish the extremes of this interval.
var ymax = Number.MIN_VALUE;
var ymin = Number.MAX_VALUE;
You have certainly noticed that at Ymax we have the smallest possible value manageable by JavaScript, while for Ymin we did the opposite, assigning it the greatest possible value manageable by JavaScript. This is because in the iterations needed to establish the values of maximum and minimum contained within the JSON structure, you will need to start from the opposite extreme values.
Within the d3.json() function, add the getXYfromJSONtree() function to the other two cluster.nodes() and cluster.links() functions, so you also read the x and Y attributes.
d3.json("dendrogram02.json", function(error, root){
      getXYfromJSONTree(root);
      var nodes = cluster.nodes(root);
      var links = clister.links(nodes);
Once all the elements of the structure have been defined, it is time to overwrite all the x and Y attributes within the nodes array (all except those ‘ undefined ‘).
nodes.forEach(
     function(d,i){
          if(typeof xs[i] != 'undefined'){
                d.x = xs[i];
          }
          if(typeof ys[i] != 'undefined'){
                d.y = ys[i];
          }
});
Now is the time to determine the range of values of distances, and then we do a scan into the ID nodes to derive the ymin and ymax values
nodes.forEach(
       function(d){
            if(d.y > ymax)
                  ymax = d.y;
            if(d.y < ymin)
                  ymin = d.y;
});
Now we define the scale of distances x (x-axis), defining the domain and the range. I remember that the domain is the extension of the values contained within the structure while the range is the range (in pixels) of the drawing area where the scale will be shown. We also define a xinv scale that is perfectly the opposite of that x, i.e. the same scale, but in the contrary direction.
x = d3.scale.linear().domain([ymin, ymax]).range([0, width-200]);
xinv = d3.scale.linear().domain([ymax, ymin]).range([0, width-200]);
Let’s remember to change the values of d.y and d.x within the code according to the scale just defined.
var node = svg.selectAll(".node")
     .data(nodes)
     .enter().append("g")
     .attr("class","node")
     .attr("transform", function(d) { return "translate(" + x(d.y) + "," + d.x + ")"; });
And finally we conclude the whole by representing in the upper part of the drawing area the axis bearing the X-scale.
var g = d3.select("svg").append("g").attr("transform","translate(100,40)");
    g.append("line")
   .attr("x1",x(ymin))
   .attr("y1",0)
   .attr("x2",x(ymax))
   .attr("y2",0);

g.selectAll(".ticks")
   .data(x.ticks(5))
   .enter().append("line")
   .attr("class","ticks")
   .attr("x1", function(d) { return xinv(d); })
   .attr("y1", -5)
   .attr("x2", function(d) {return xinv(d); })
   .attr("y2", 5);

g.selectAll(".label")
   .data(x.ticks(5))
   .enter().append("text")
   .attr("class","label")
   .text(String)
   .attr("x", function(d) {return xinv(d); })
   .attr("y", -5)
   .attr("text-anchor","middle");
With this we have concluded the third article.
In the next article we will see how to add an additional distance: the one that elapses between the leaves. We will implement the Dendrogram code in order to also handle the X-values defined within the JSON structure.