Introduction
It’s been several months since I wrote a series of articles that treated the development of dendrograms through the use of the JavaScript library D3. However, I recently received a series of requests to deepen the topic, which apparently seems to have enjoyed a fairly successful.

In this regard, I decided to start writing articles on this beautiful bookcase, dealing one after another with a lot of topics and representations. To start over, I decided to conclude the topic of dendrograms with a fifth article.
If you are interested in deepening the topic, within the book Beginning JavaScript Charts are presented various methodologies of data acquisition, from extracting data from a table of a database (via PHP), reading and parsing data Contained in an external file. It also explains in detail the JSON format, and thanks to many examples it is shown how practical it is to use it on these occasions.
For anyone who wants to start from previous articles…
- How to make a dendrogram with the D3 Library (Part 1)
- How to make a dendrogram with the D3 Library (Part 2)
- How to make a dendrogram with the D3 Library (Part 3)
- How to make a dendrogram with the D3 Library (Part 4)
The starting Code
Let’s start from the code dendrogram01.html in the article how to make a dendrogram with the library D3 (part 2) that produced the following dendrogram.
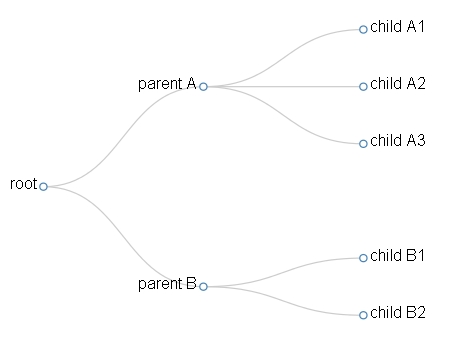
For convenience, I propose here the JavaScript code that generates it:
var width = 600;
var height = 500;
var cluster = d3.layout.cluster()
    .size([height, width-200]);
var diagonal = d3.svg.diagonal()
    .projection (function(d) { return [d.y, d.x];});
var svg = d3.select("body").append("svg")
    .attr("width",width)
    .attr("height",height)
    .append("g")
    .attr("transform","translate(100,0)");

d3.json("dendrogram01.json", function(error, root){
    var nodes = cluster.nodes(root);
    var links = cluster.links(nodes);
    var link = svg.selectAll(".link")
        .data(links)
        .enter().append("path")
        .attr("class","link")
        .attr("d", diagonal);
    var node = svg.selectAll(".node")
        .data(nodes)
        .enter().append("g")
        .attr("class","node")
        .attr("transform", function(d) { return "translate(" + d.y + "," + d.x + ")"; });
    node.append("circle")
        .attr("r", 4.5);
    node.append("text")
        .attr("dx", function(d) { return d.children ? -8 : 8; })
        .attr("dy", 3)
        .style("text-anchor", function(d) { return d.children ? "end" : "start"; })
        .text( function(d){ return d.name;});
});
These are the CSS definitions:
.node circle {
     fill: #fff;
     stroke: steelblue;
     stroke-width: 1.5px;
}
.node {
     font: 20px sans-serif;
}
.link {
     fill: none;
     stroke: #ccc;
     stroke-width: 1.5px;
}
And this is the contents of the DENDROGRAM02. Json file that consists of the data structure.
{   "name": "root",
    "children": [
         {      "name": "parent A",
                "children": [
                      {"name": "child A1"},
                      {"name": "child A2"},
                      {"name": "child A3"}
                 ]
         },{      "name": "parent B",
                  "children": [
                      {"name": "child B1"},
                      {"name": "child B2"}
                 ]
         }   ]
}
In the course of the article we are going to modify this code in order to obtain a circular dendrogram.
Change the Code
Since we are talking about a circular representation on which to radially distribute the nodes of the Dendrogram, it will be necessary to express the dimensions of the representation through the diameter, instead of the classical height and width.
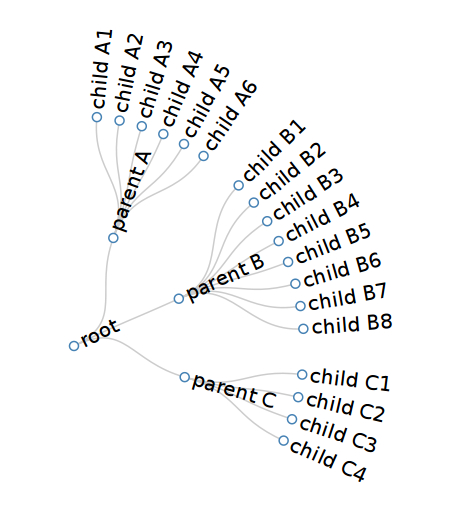
Then you delete the variables width and height (in the snippet are commented for convenience). You then define a radius variable, which will correspond to the extension of the drawing area. You also define the margin variables, which defines the margin to be interposing between the drawing area and the Dendrogram itself. and the variable angle, which represents the cover angle of the circular dendrogram. The value 360° expresses a lap angle and then the terminal nodes of the Dendrogram will be distributed along the entire circumference. A lesser value (for example of 120°) Porterebbee the Dendrogram representation as a fan (see Fig. 4).
//var width = 600;
//var height = 500;
var radius = 350;
var margin = 120;
var angle = 360;
As a result, the cluster data structure must also be changed accordingly. Similarly also d3.svg.diagonal must be modified to be considered radially.
var cluster = d3.layout.cluster()
    //.size([height, width-200]);
    .size([angle, radius - margin]);
    //var diagonal = d3.svg.diagonal()
        // .projection (function(d) { return [d.y, d.x];});
    var diagonal = d3.svg.diagonal.radial()
        .projection (function(d) { return [d.y, d.x / 180* Math.PI];});
The definition of the drawing area must also be changed.
var svg = d3.select("body").append("svg")
    //.attr("width",width)
    //.attr("height",height)
    .attr("width",2*radius)
    .attr("height",2*radius)
    .append("g")
    //.attr("transform","translate(100,0)");
    .attr("transform","translate("+radius + "," + radius + ")");
As far as the dendrogram representation is concerned, only the line expressing the svg.transform() of the nodes must be modified.
var node = svg.selectAll(".node")
    .data(nodes)
    .enter().append("g")
    .attr("class","node")
    .attr("transform", function(d) { return "rotate(" + (d.x - 90) + ")translate(" + d.y + ")"; });
    //.attr("transform", function(d) { return "translate(" + d.y + "," + d.x + ")"; });
Now all the changes to be made to the code have been executed. Here is the complete code expressed here for convenience.
var radius = 350;
var margin = 120;
var angle = 120;
var cluster = d3.layout.cluster()
    .size([angle, radius-margin]);
var diagonal = d3.svg.diagonal.radial()
    .projection (function(d) { return [d.y, d.x / 180* Math.PI];});  var svg = d3.select("body").append("svg")
    .attr("width",2*radius)
    .attr("height",2*radius)
    .append("g")
    .attr("transform","translate("+radius + "," + radius + ")");

d3.json("dendrogram02.json", function(error, root){
    var nodes = cluster.nodes(root);
    var links = cluster.links(nodes);
    var link = svg.selectAll(".link")
        .data(links)
        .enter().append("path")
        .attr("class","link")
        .attr("d", diagonal);
    var node = svg.selectAll(".node")
        .data(nodes)
        .enter().append("g")
        .attr("class","node")
        .attr("transform", function(d) { return "rotate(" + (d.x - 90) + ")translate(" + d.y + ")"; });
    node.append("circle")
        .attr("r", 4.5);
    node.append("text")
        .attr("dy", ".31em")
        .attr("text-anchor", function(d) { return d.x < 180 ? "start" : "end"; })
        .attr("transform", function(d) { return d.x < 180 ? "translate(8)" : "rotate(180)translate(-8)"; })
        .text(function(d) { return d.name; });
});
By loading the page from the browser, we get the following representation:
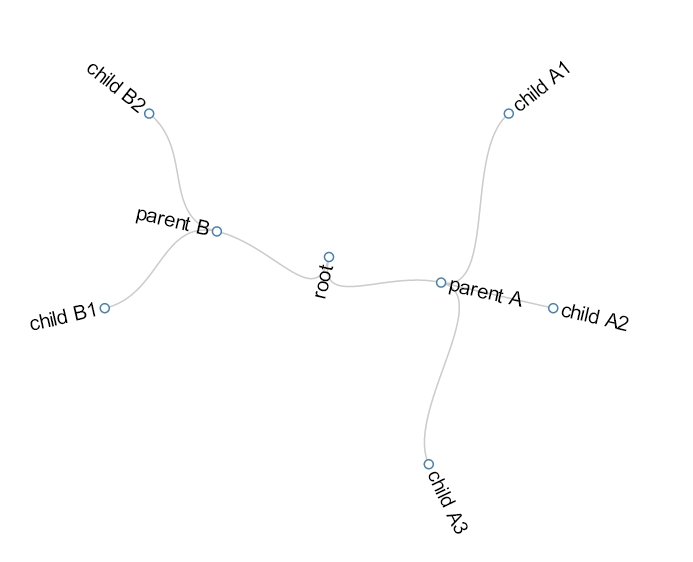
We certainly can’t say that we got a nice circular dendrogram. This is because the Dendrogram is too simple in its structure. We make the structure more complex, going to add more elements to the structure contained in the JSON file that we used.
{  "name": "root",
   "children": [  {
        "name": "parent A",
        "children": [
             {"name": "child A1"},
             {"name": "child A2"},
             {"name": "child A3"},
             {"name": "child A4"},
             {"name": "child A5"},
             {"name": "child A6"}
         ]
    },{
        "name": "parent B",
        "children": [
             {"name": "child B1"},
             {"name": "child B2"},
             {"name": "child B3"},
             {"name": "child B4"},
             {"name": "child B5"},
             {"name": "child B6"},
             {"name": "child B7"},
             {"name": "child B8"}
          ]
     },{
        "name": "parent C",
        "children": [
             {"name": "child C1"},
             {"name": "child C2"},
             {"name": "child C3"},
             {"name": "child C4"}
          ]
       }]
}
Now if we reupload the page from our browser, we get:
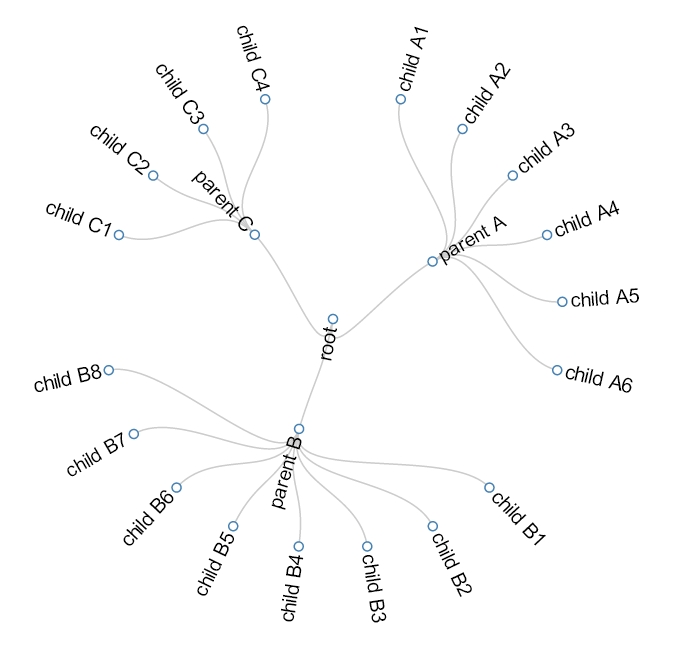
So now things seem to work very well. Now the circular and uniform distribution of the dendrogram leaves along the circular perimeter is quite evident.
So far we have worked with dendrograms at two levels beyond the root (n = 2). Actually manageable levels can be many more. So far so good, as long as the diameter of the circular dendrogram will be large enough to correctly display all the elements.
Manage different hierarchical levels
In fact a borderline case that we have not considered so far, is for example to consider dendrograms with branches that have more levels than others.
Let’s take an example:
{  "name": "root",
   "children": [  {
         "name": "parent A",
         "children": [
                {"name": "child A1",
                 "children": [
                       {"name": "child A1-1"},
                       {"name": "child A1-2"},
                       {"name": "child A1-3"},
                       {"name": "child A1-4"},
                       {"name": "child A1-5"},
                       {"name": "child A1-6"},
                       {"name": "child A1-7"}
                 ]     },
                {"name": "child A2",
                 "children": [
                       {"name": "child A2-1"},
                       {"name": "child A2-2"},
                       {"name": "child A2-3"}
                 ]     },
                {"name": "child A3",
                 "children": [
                       {"name": "child A3-1"},
                       {"name": "child A3-2"},
                       {"name": "child A3-3"}
                 ]     },
                 {"name": "child A4",
                 "children": [
                       {"name": "child A4-1"},
                       {"name": "child A4-2"},
                       {"name": "child A4-3"}
                 ]     },
                 {"name": "child A5",
                 "children": []     },
                 {"name": "child A6",
                 "children": [
                       {"name": "child A6-1"},
                       {"name": "child A6-2"},
                       {"name": "child A6-3"}
                 ]    }]
        },{
          "name": "parent B",
          "children": [
                {"name": "child B1"},
                {"name": "child B2"},
                {"name": "child B3"},
                {"name": "child B4"},
                {"name": "child B5"},
                {"name": "child B6"},
                {"name": "child B7"},
                {"name": "child B8"}
           ]
         },{
          "name": "parent C",
          "children": [
                {"name": "child C1"},
                {"name": "child C2"},
                {"name": "child C3"},
                {"name": "child C4"}
         ]
}] }
If we launch the page again, we will get this…
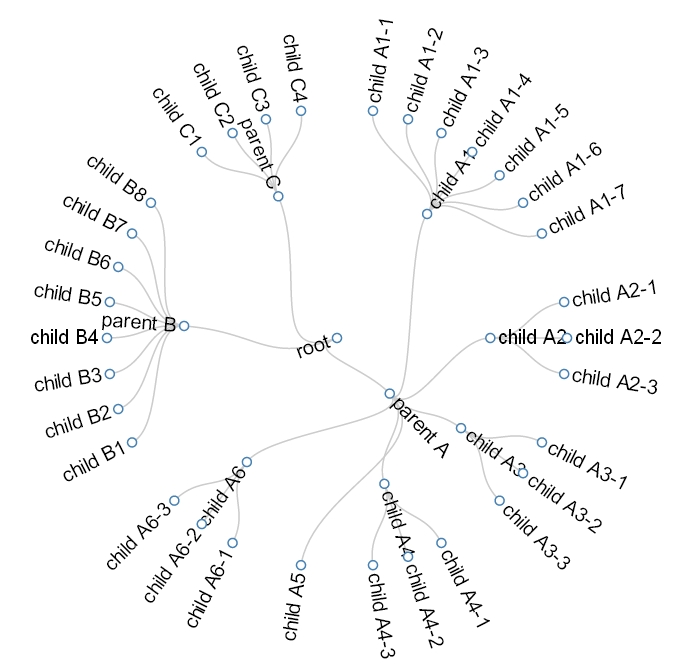
If we look at the Dendrogram produced, we will notice immediately that the elements of a lower level (n = 4) have been placed at the same level as those with n = 3 along the outer perimeter of the circular dendrogram.
On the net there are often dendrograms expressed in this way, since the attention is centered on the terminal elements of the dendrogram (leaves), independently of their hierarchical level of belonging. In fact, if you want hierarchical information to be maintained by respecting the hierarchies of the various levels correctly, you need to replace the d3.layout.cluster with d3.layout.tree.
var tree = d3.layout.tree()
     .size([360, diameter / 2 - 120]);
     ...
d3.json("dendrogram04.json", function(error, root){
     var nodes = tree.nodes(root);
     var links = tree.links(nodes);
     ...
});
To obtain the following circular representation of the Dendrogram.
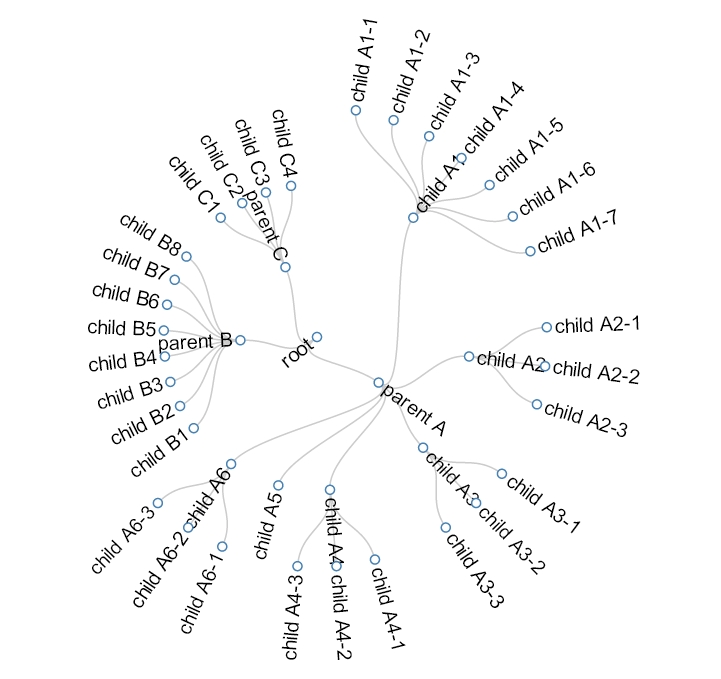
Now each hierarchical level is distributed at a precise distance from the center of the Dendrogram (the root). As the level n also grows the distance from the center will grow accordingly.