This is the fourth of a series of articles illustrating how to develop a dendrogram, using the D3 JavaScript Library, built on the basis of a particular data structure contained within a JSON file.
Read the article:
- How to make a dendrogram with the D3 Library (Part 1)
- How to make a dendrogram with the D3 Library (Part 2)
- How to make a dendrogram with the D3 Library (Part 3)
In the previous article we created a dendrogram in which the ultrametric distances were taken into account.
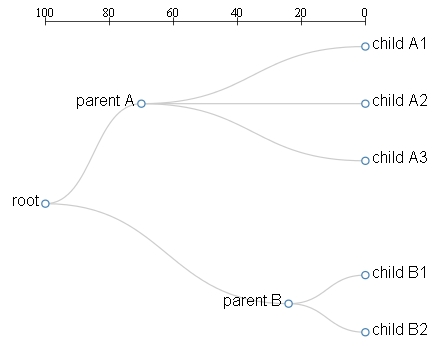
In This article we will see how it is possible to manage an additional distance between the various nodes, distance that is expressed within the Dendrogram through the vertical position of the various knots.
We have seen in previous articles that the position of the various nodes of the Dendrogram is expressible in the JSON structure by attributing the values (x, y) to the corresponding x and Y attributes of each node.
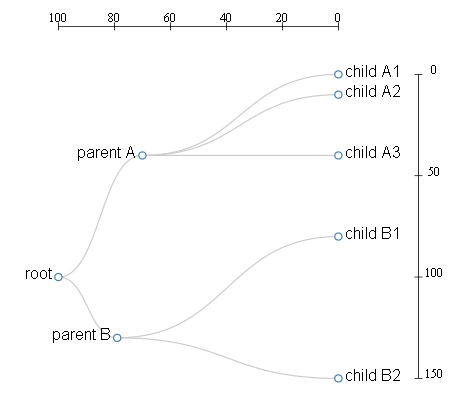
So to get the dendrogram expressed in Figure 2, let’s edit the following JSON structure, saving it as dendrogram03.json.
{   "name": "root",
    "y" : 0,
    "x" : 100,
    "children": [
        {"name": "parent A",
         "y" : 30,
         "x" : 40,
         "children": [
             {"name": "child A1",
              "y" : 100,
              "x" : 0},
             {"name": "child A2",
              "y" : 100,
              "x" : 10},
             {"name": "child A3",
              "y" : 100,
              "x" : 40}     ]
          },{"name": "parent B",
          "y" : 21,
          "x" : 130,
          "children": [
              {"name": "child B1",
               "y" : 100,
               "x" : 80},
              {"name": "child B2",
               "y" : 100,
               "x" : 150}
           ]   }
] }
As we can see, this time all nodes have an X-value and a Y-value defined within it.
Now we implement the Web page with which we will represent our dendrogram.
<!doctype html>
<html>
<meta charset="utf-8">
<style>
.node circle {
     fill: #fff;
     stroke: steelblue;
     stroke-width: 1.5px;
}
.node {
     font: 20px sans-serif;
}
link {
     fill: none;
     stroke: #ccc;
     stroke-width: 1.5px;
}
line {
     stroke: black;
}
</style>
<script type="text/javascript" src="http://d3js.org/d3.v3.min.js"> <script type="text/javascript">
var width = 600;
var height = 500;
var cluster = d3.layout.cluster()
     .size([height, width-200]);
var diagonal = d3.svg.diagonal()
     .projection (function(d) { return [x(d.y), y(d.x)];});
var svg = d3.select("body").append("svg")
     .attr("width",width)
     .attr("height",height)
     .append("g")
     .attr("transform","translate(100,0)");
xs = [];
ys = [];
function getXYfromJSONTree(node){
     xs.push(node.x);
     ys.push(node.y);
     if(typeof node.children != 'undefined'){
          for ( j in node.children){
                getXYfromJSONTree(node.children[j]);
          }
     }
}
var ymax = Number.MIN_VALUE;
var ymin = Number.MAX_VALUE;
var xmax = Number.MIN_VALUE;
var xmin = Number.MAX_VALUE;
d3.json("dendrogram03.json", function(error, json){
    getXYfromJSONTree(json);
    var nodes = cluster.nodes(json);
    var links = cluster.links(nodes);
    nodes.forEach( function(d,i){
         if(typeof xs[i] != 'undefined'){
              d.x = xs[i];
         }
         if(typeof ys[i] != 'undefined'){
              d.y = ys[i];
         }
    });

nodes.forEach( function(d){
    if(d.y > ymax)
        ymax = d.y;
    if(d.y < ymin)
        ymin = d.y;
    if(d.x > xmax)
        xmax = d.x;
    if(d.x < xmin)
        xmin = d.x;
});
x = d3.scale.linear().domain([ymin, ymax]).range([0, width-250]);       xinv = d3.scale.linear().domain([ymax, ymin]).range([0, width-250]);        y = d3.scale.linear().domain([xmin, xmax]).range([100, height-20]);       var link = svg.selectAll(".link")
    .data(links)
    .enter().append("path")
    .attr("class","link")
    .attr("d", diagonal);
var node = svg.selectAll(".node")
    .data(nodes)
    .enter().append("g")
    .attr("class","node")
    .attr("transform", function(d) {
         return "translate(" + x(d.y) + "," + y(d.x) + ")";
     });
node.append("circle")
    .attr("r", 4.5);
node.append("text")
    .attr("dx", function(d) { return d.children ? -8 : 8; })
    .attr("dy", 3)
    .style("text-anchor", function(d) { return d.children ? "end" : "start"; })
    .text( function(d){ return d.name;});
// x-Axis
var g = d3.select("svg").append("g")
    .attr("transform","translate(100,40)");
g.append("line")
    .attr("x1",x(ymin))
    .attr("y1",0)
    .attr("x2",x(ymax))
    .attr("y2",0);
g.selectAll(".xticks")
    .data(x.ticks(5))
    .enter().append("line")
    .attr("class","ticks")
    .attr("x1", function(d) { return xinv(d); })
    .attr("y1", -5)
    .attr("x2", function(d) {return xinv(d); })
    .attr("y2", 5);
g.selectAll(".xlabel")
    .data(x.ticks(5))
    .enter().append("text")
    .attr("class","label")
    .text(String)
    .attr("x", function(d) {return xinv(d); })
    .attr("y", -5)
    .attr("text-anchor","middle");
// y-Axis
var g = d3.select("svg").append("g")
    .attr("transform","translate(100,0)");   g.append("line")
    .attr("x1",x(ymax)+100)
    .attr("y1",y(xmin))
    .attr("x2",x(ymax)+100)
    .attr("y2",y(xmax));
g.selectAll(".yticks")
    .data(y.ticks(5))
    .enter().append("line")
    .attr("class","ticks")
    .attr("x1", x(ymax)+95)
    .attr("y1", function(d) { return y(d); })
    .attr("x2", x(ymax)+105)
    .attr("y2", function(d) {return y(d); });       g.selectAll(".ylabel")
    .data(y.ticks(5))
    .enter().append("text")
    .attr("class","label")
    .text(String)
    .attr("x", x(ymax)+120)
    .attr("y", function(d) {console.log(y.ticks(4));return y(d); })
    .attr("text-anchor","middle"); });
</script>
Now let’s look at all the code changes from the previous article together. Since we need to define an additional scale (Y-axis) that manages the extension of X-values within the JSON structure, we also define Xmax and xmin for X-values.
var xmax = Number. MIN_VALUE;
var xmin = Number. MAX_VALUE;
Within the iteration for the search for the maximum and minimum values must include, in addition to the attribute Y, also the attribute x.
nodes.forEach( function(d){
    if(d.y > ymax)
        ymax = d.y;
    if(d.y < ymin)
        ymin = d.y;
    if(d.x > xmax)
        xmax = d.x;
    if(d.x < xmin)
        xmin = d.x;
});
We define the new distance on the y-axis, defining a Y-scale, appropriately sending the domain and the range.
y = d3.scale.linear().domain([xmin, xmax]).range([100, height-20]);Now also the values x and y must be represented in scale and then make the appropriate modifications to the code:
var node = svg.selectAll(".node")
    .data(nodes)
    .enter().append("g")
    .attr("class","node")
    .attr("transform", function(d) { return "translate(" + x(d.y) + "," + y(d.x) + ")"; });
Finally we add an additional axis to our Dendrogram, taking care to place it at the right edge of the figure. We also draw within it (as we did for the x-axis) the ticks and the corresponding numeric values:
// y-Axis
var g = d3.select("svg").append("g")
     .attr("transform","translate(100,0)");
g.append("line")
     .attr("x1",x(ymax)+100)
     .attr("y1",y(xmin))
     .attr("x2",x(ymax)+100)
     .attr("y2",y(xmax));
g.selectAll(".yticks")
     .data(y.ticks(5))
     .enter().append("line")
     .attr("class","ticks")
     .attr("x1", x(ymax)+95)
     .attr("y1", function(d) { return y(d); })
     .attr("x2", x(ymax)+105)
     .attr("y2", function(d) {return y(d); });
g.selectAll(".ylabel")
     .data(y.ticks(5))
     .enter().append("text")
     .attr("class","label")
     .text(String)
     .attr("x", x(ymax)+120)
     .attr("y", function(d) {console.log(y.ticks(4));return y(d); })
     .attr("text-anchor","middle");
That’s where we got a dendrogram at two distances.
With this is finished the fourth article on Dendrograms.